The Most Popular Alcohol by State, #Burgerflation, and Cafe & Bakery Insights
Sep 12, 2023
Ohio drinks 160% more hard seltzer per restaurant location than other U.S. states.
BOSTON, MA – Toast (NYSE: TOST), the all-in-one digital platform built for restaurants, today announced its Q2 2023 Restaurant Trends Report, providing insight into the overall state of the U.S. restaurant industry through an analysis of aggregated sales data from selected cohorts of restaurants in select U.S. metropolitan areas on the Toast platform, which serves approximately 93,000 restaurant locations as of June 30, 2023. Read more details about our methodology below.
Wine, spirits, beer, cider, and hard seltzer
To better understand alcohol trends in restaurants, Toast analyzed how the popularity of select drinks and spirits varied for restaurants on the Toast platform from state to state. Toast analyzed the sale of beer, wine, cider, hard seltzer, and spirits: vodka, tequila, whiskey, gin, rum, and brandy. 1
America loves beer
The most popular alcoholic drink in all 50 states for the cohort we observed is a nice, cold beer. Minnesota, in particular, really likes beer, drinking about 53% more beer per restaurant location than the average of all 50 states. Kansas and Pennsylvania ranked second and third for the most beer consumed per restaurant location.
While vodka is the most popular spirit in most states, our data showed that tequila is more popular than vodka in Arizona, California, Colorado, Georgia, Hawaii, Louisiana, New Mexico, Texas, and Utah. Whiskey is the most popular spirit in the restaurants we observed in West Virginia, Wyoming, Indiana, Kansas, and Kentucky.
And while we’re on the topic of Kentucky whiskey, we were surprised to find that diners at restaurants we looked at in Kansas, on average, drank more whiskey than any other state in Q2 2023. Ohio and Kentucky ranked second and third, respectively, for the most whiskey consumed per restaurant location that we observed in Q2 2023. 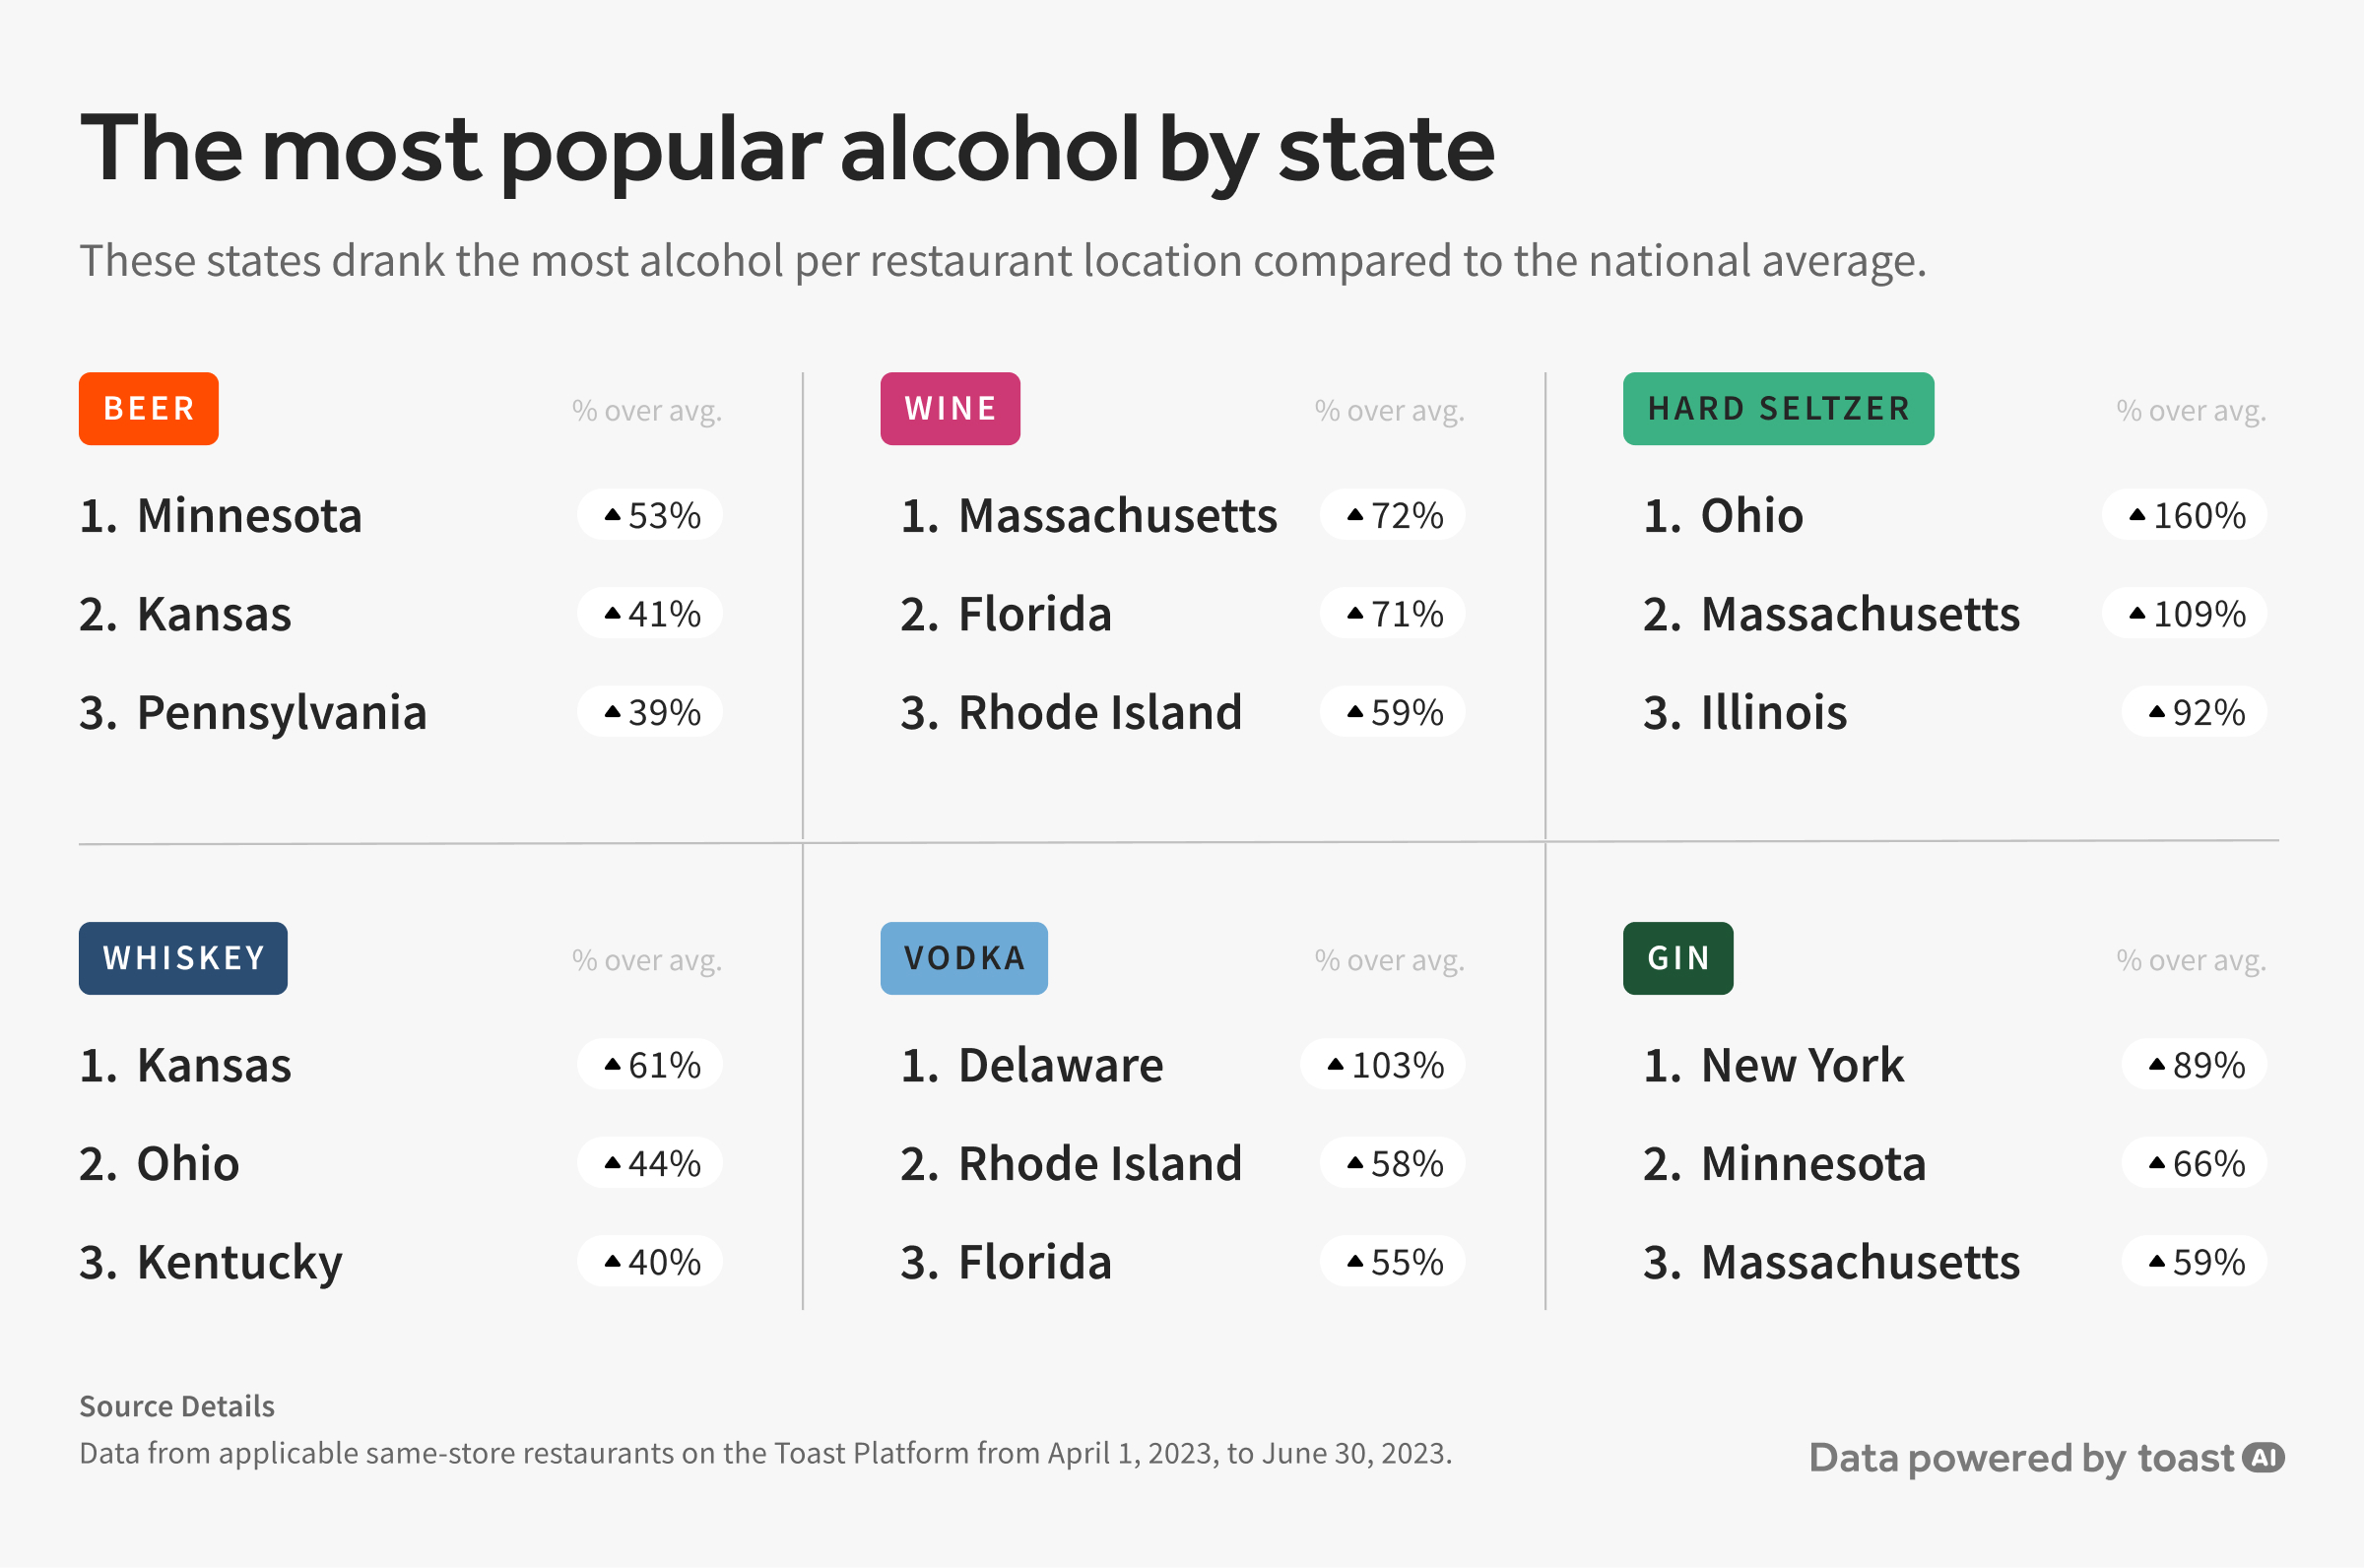
1 Methodology: Toast analyzed transactions from a cohort of restaurants on the Toast platform from April 1, 2023, to June 30, 2023, to determine the popularity of beer, wine, cider, hard seltzer, vodka, tequila, whiskey, gin, rum, and brandy per restaurant location in all 50 U.S. states in Q2 2023. Toast used a cohort of same-store customers on the platform since Q1 2022 that served alcohol.
Ohio goes hard for hard seltzer
Our data suggests that Ohio is the hard seltzer capital of the United States. Ohio sold on average 160% more hard seltzers per restaurant location than restaurants in other states. Massachusetts and Illinois have also developed a love for the bubbly beverage. On the other end of the spectrum, restaurants we looked at in Wyoming served the least amount of hard seltzer compared to restaurants in every other state, averaging about 66% less hard seltzers than the average in Q2 2023.
While trends show that hard seltzer is most popular in the summer months, peaking in July, the drink shows no signs of slowing down, so restaurants might consider stocking up and get it on the menu if they haven’t already.
Down South, they shoot tequila
It’s no surprise that tequila has heavily influenced states along the Mexican border. Texas was the highest consumer of tequila per restaurant location in our cohort in Q2 2023, drinking 119% more tequila than the average for diners at restaurants we looked at in other states. Georgia, Arizona, and Florida were also top consumers of tequila.
Wine at the beach
Maybe something in the Atlantic has people reaching for a glass of rosé after a day at the beach. Massachusetts is the largest consumer of wine per restaurant location that we looked at out of all 50 states, drinking 72% more wine than the average in Q2 2023. Florida ranked second for the most wine served per restaurant location, and Rhode Island, with its picturesque beaches and abundance of seafood, placed third.
Last call
And finally, while they aren’t as popular as the other alcoholic drinks above, our data showed that gin is most popular in New York, rum is most popular in Hawaii and Louisiana, and brandy is most popular in Wisconsin. Hard cider is most popular in Vermont, according to our observations, followed by Oregon and Washington, though it is the least popular drink we explored, partly because cider season is in the fall.
The morning rush
Bakeries and cafes are often the cornerstones of our day. For many neighborhoods, a local cafe or bakery is their community gathering spot to work, catch up with old friends, or meet new ones over a delicately crafted croissant. They’re our “third place,” establishing a sense of community and creativity outside of home and work.
Along with the Toast for Cafes & Bakeries launch, we’ll dive into some recent trends in the space.
Cafes and bakeries operate earlier in the day than most restaurants, with bakers and baristas often showing up to work before the sun to prepare baked goods and pour the first espresso shots for those early risers. But are cafes and bakeries as busy as they were last year?
Toast compared the average number of same-store transactions per restaurant location at cafes and bakeries in Q2 2022 and compared it to Q2 2023 to analyze how busy they were compared to last year. The good news is that in 17 Metropolitan Statistical Areas (MSAs) in the U.S. that Toast explored, 12 experienced positive growth. Cafe and bakery restaurants include “Cafes,” "Coffee Shops," “Bakeries,” and “Dessert.”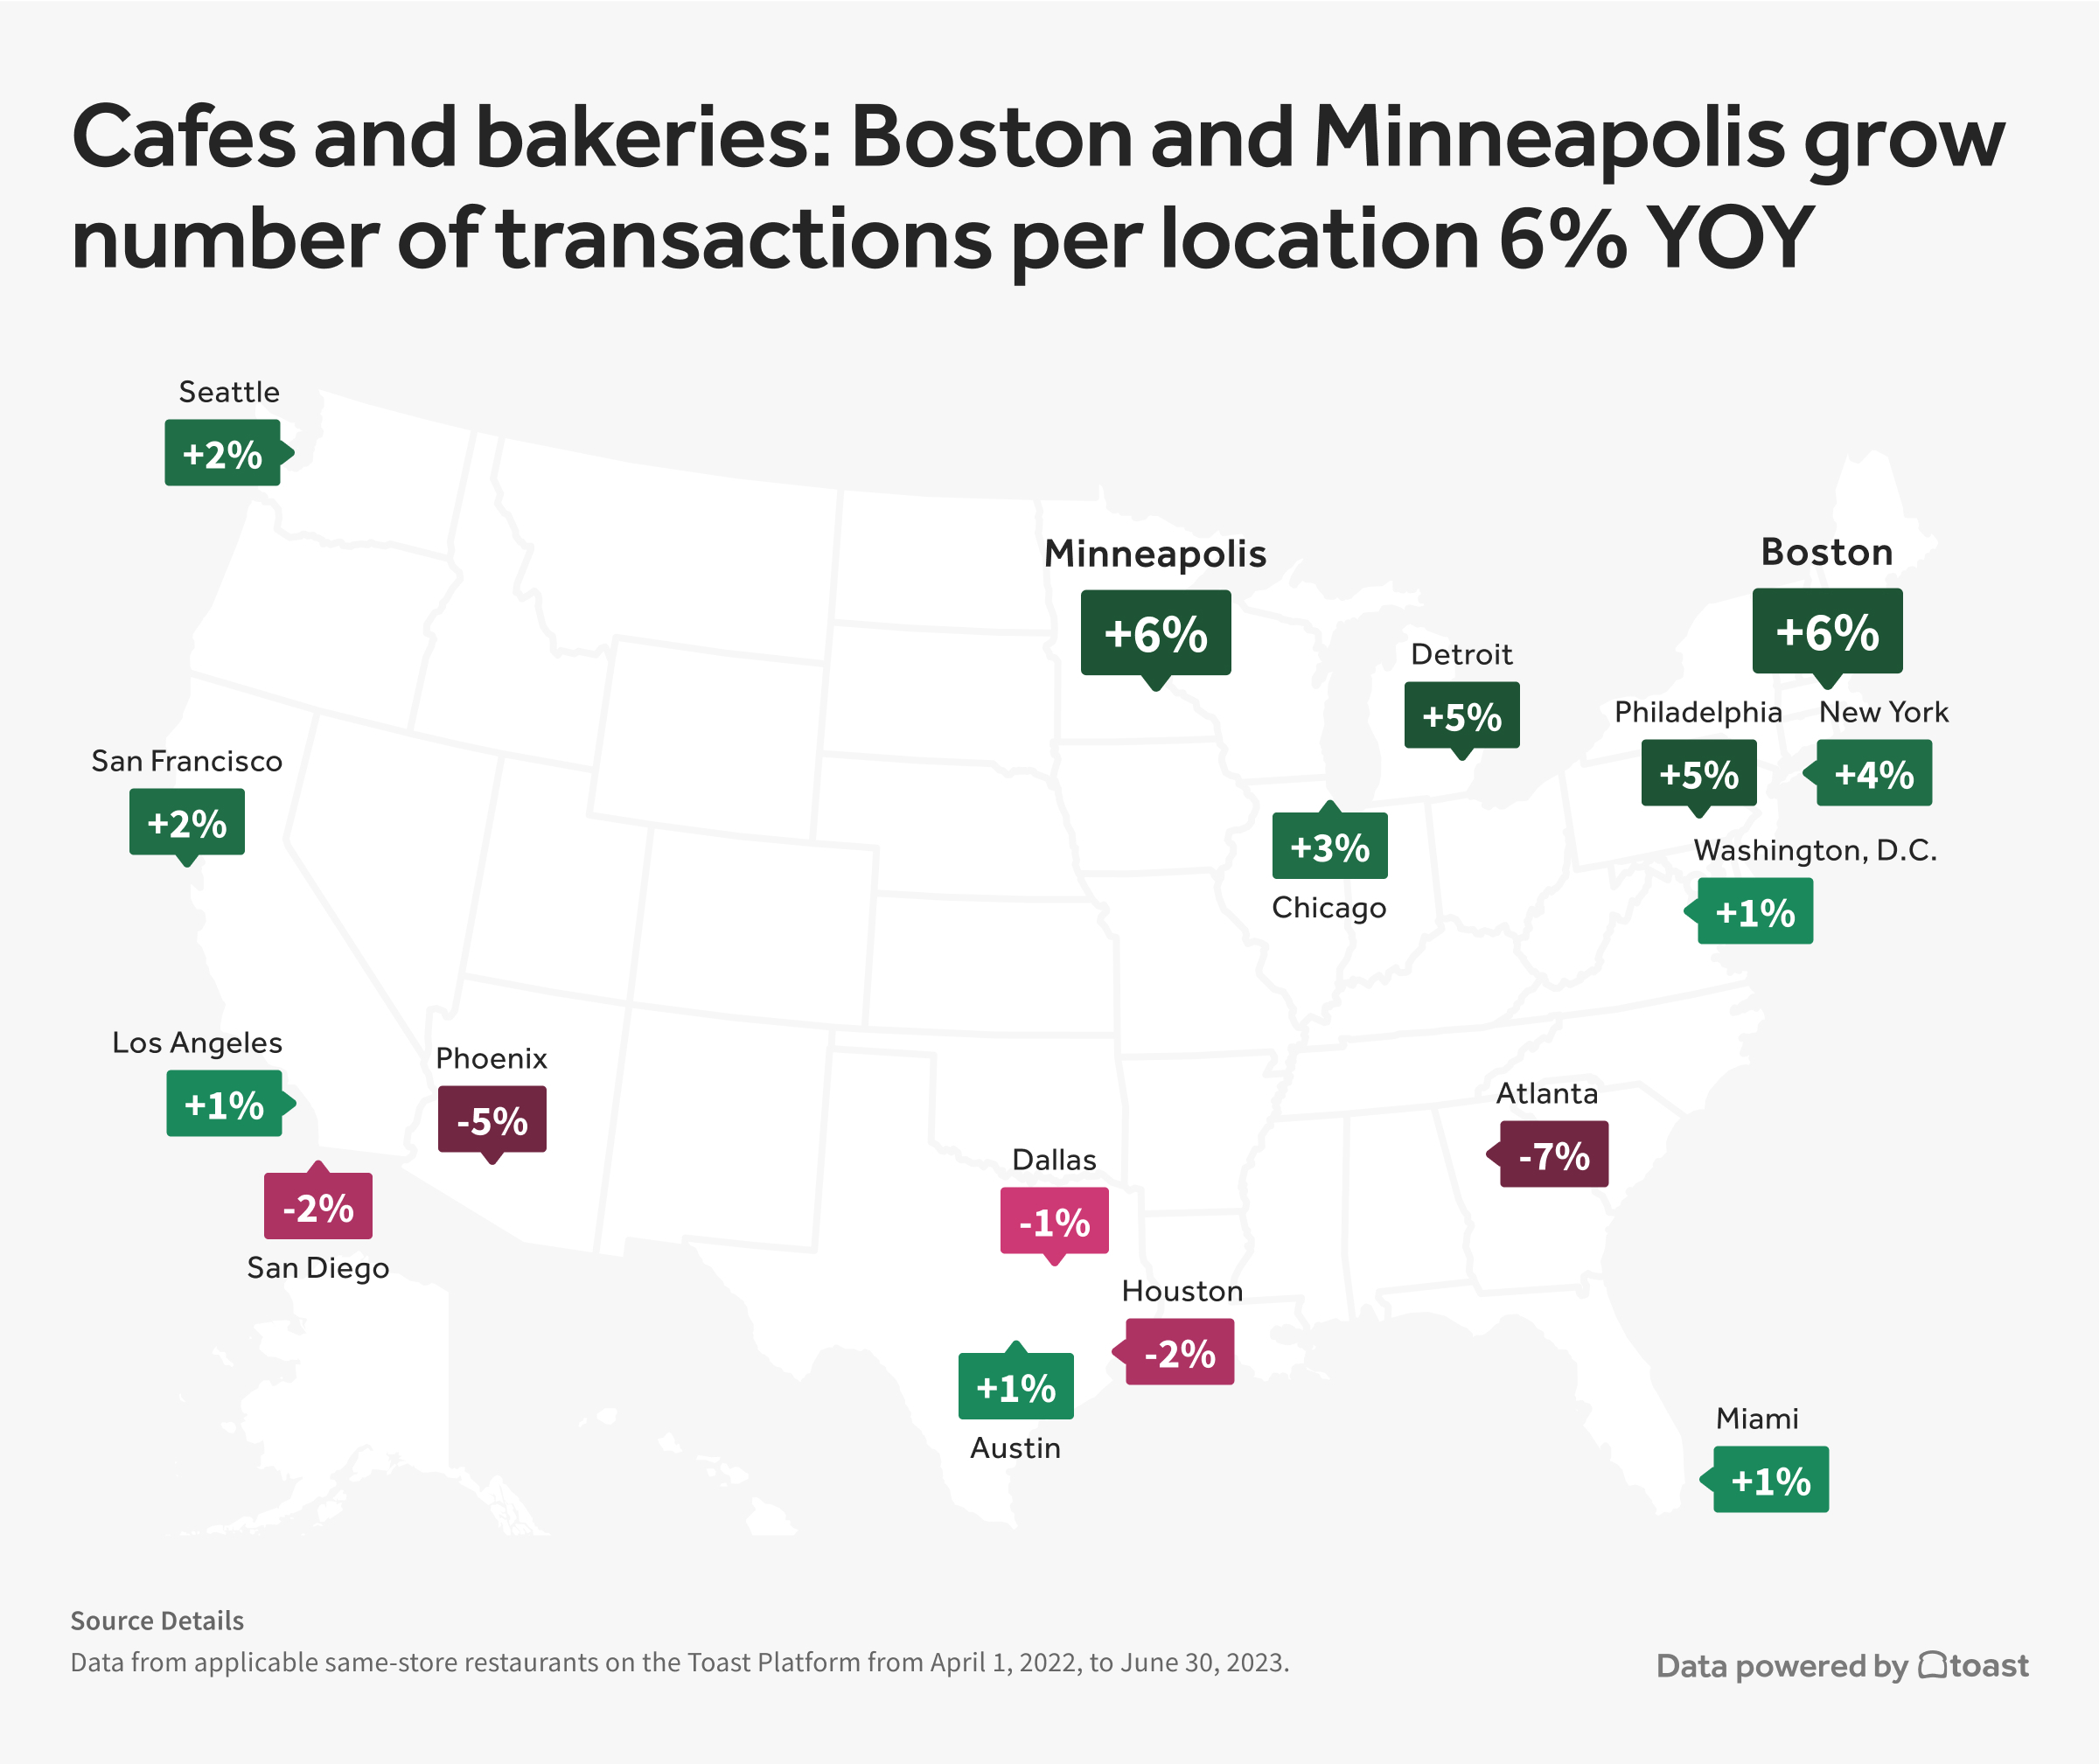
2 Methodology: Toast analyzed the number of transactions at cafes and bakeries in 17 select MSAs on the Toast platform to determine the average number of transactions per restaurant location on the Toast platform in Q2 2022 and Q2 2023. Toast used a cohort of same-store customers on the platform since Q1 2022. Transactions were not adjusted for total transaction volume. MSAs with minimal cafes and bakeries on the Toast platform were excluded.
Toast data shows that the Boston and Minneapolis metro areas increased transaction counts per restaurant location for the cohort we observed in Q2 2023 by 6% YOY (year-over-year), while the Philadelphia and Detroit metropolitan areas had an increase of 5%. Rounding out the top five, the New York City metro area also saw an increase of 4% in Q2 2023 compared to Q2 2022.
But not all metro areas we looked at experienced transaction count per restaurant location growth in the cafe and bakery segment. Most notably, the Atlanta metro area was down 7% for the cohort we observed in Q2 2023 compared to Q2 2022.
One potential explanation for the decline in transaction counts per restaurant location in the Atlanta metro area is that there may be more competition in the space. According to the Georgia Restaurant Association, there are approximately 21,500 restaurants in the state, compared to 19,000 in 2019.
Do you want that coffee for here or to go?
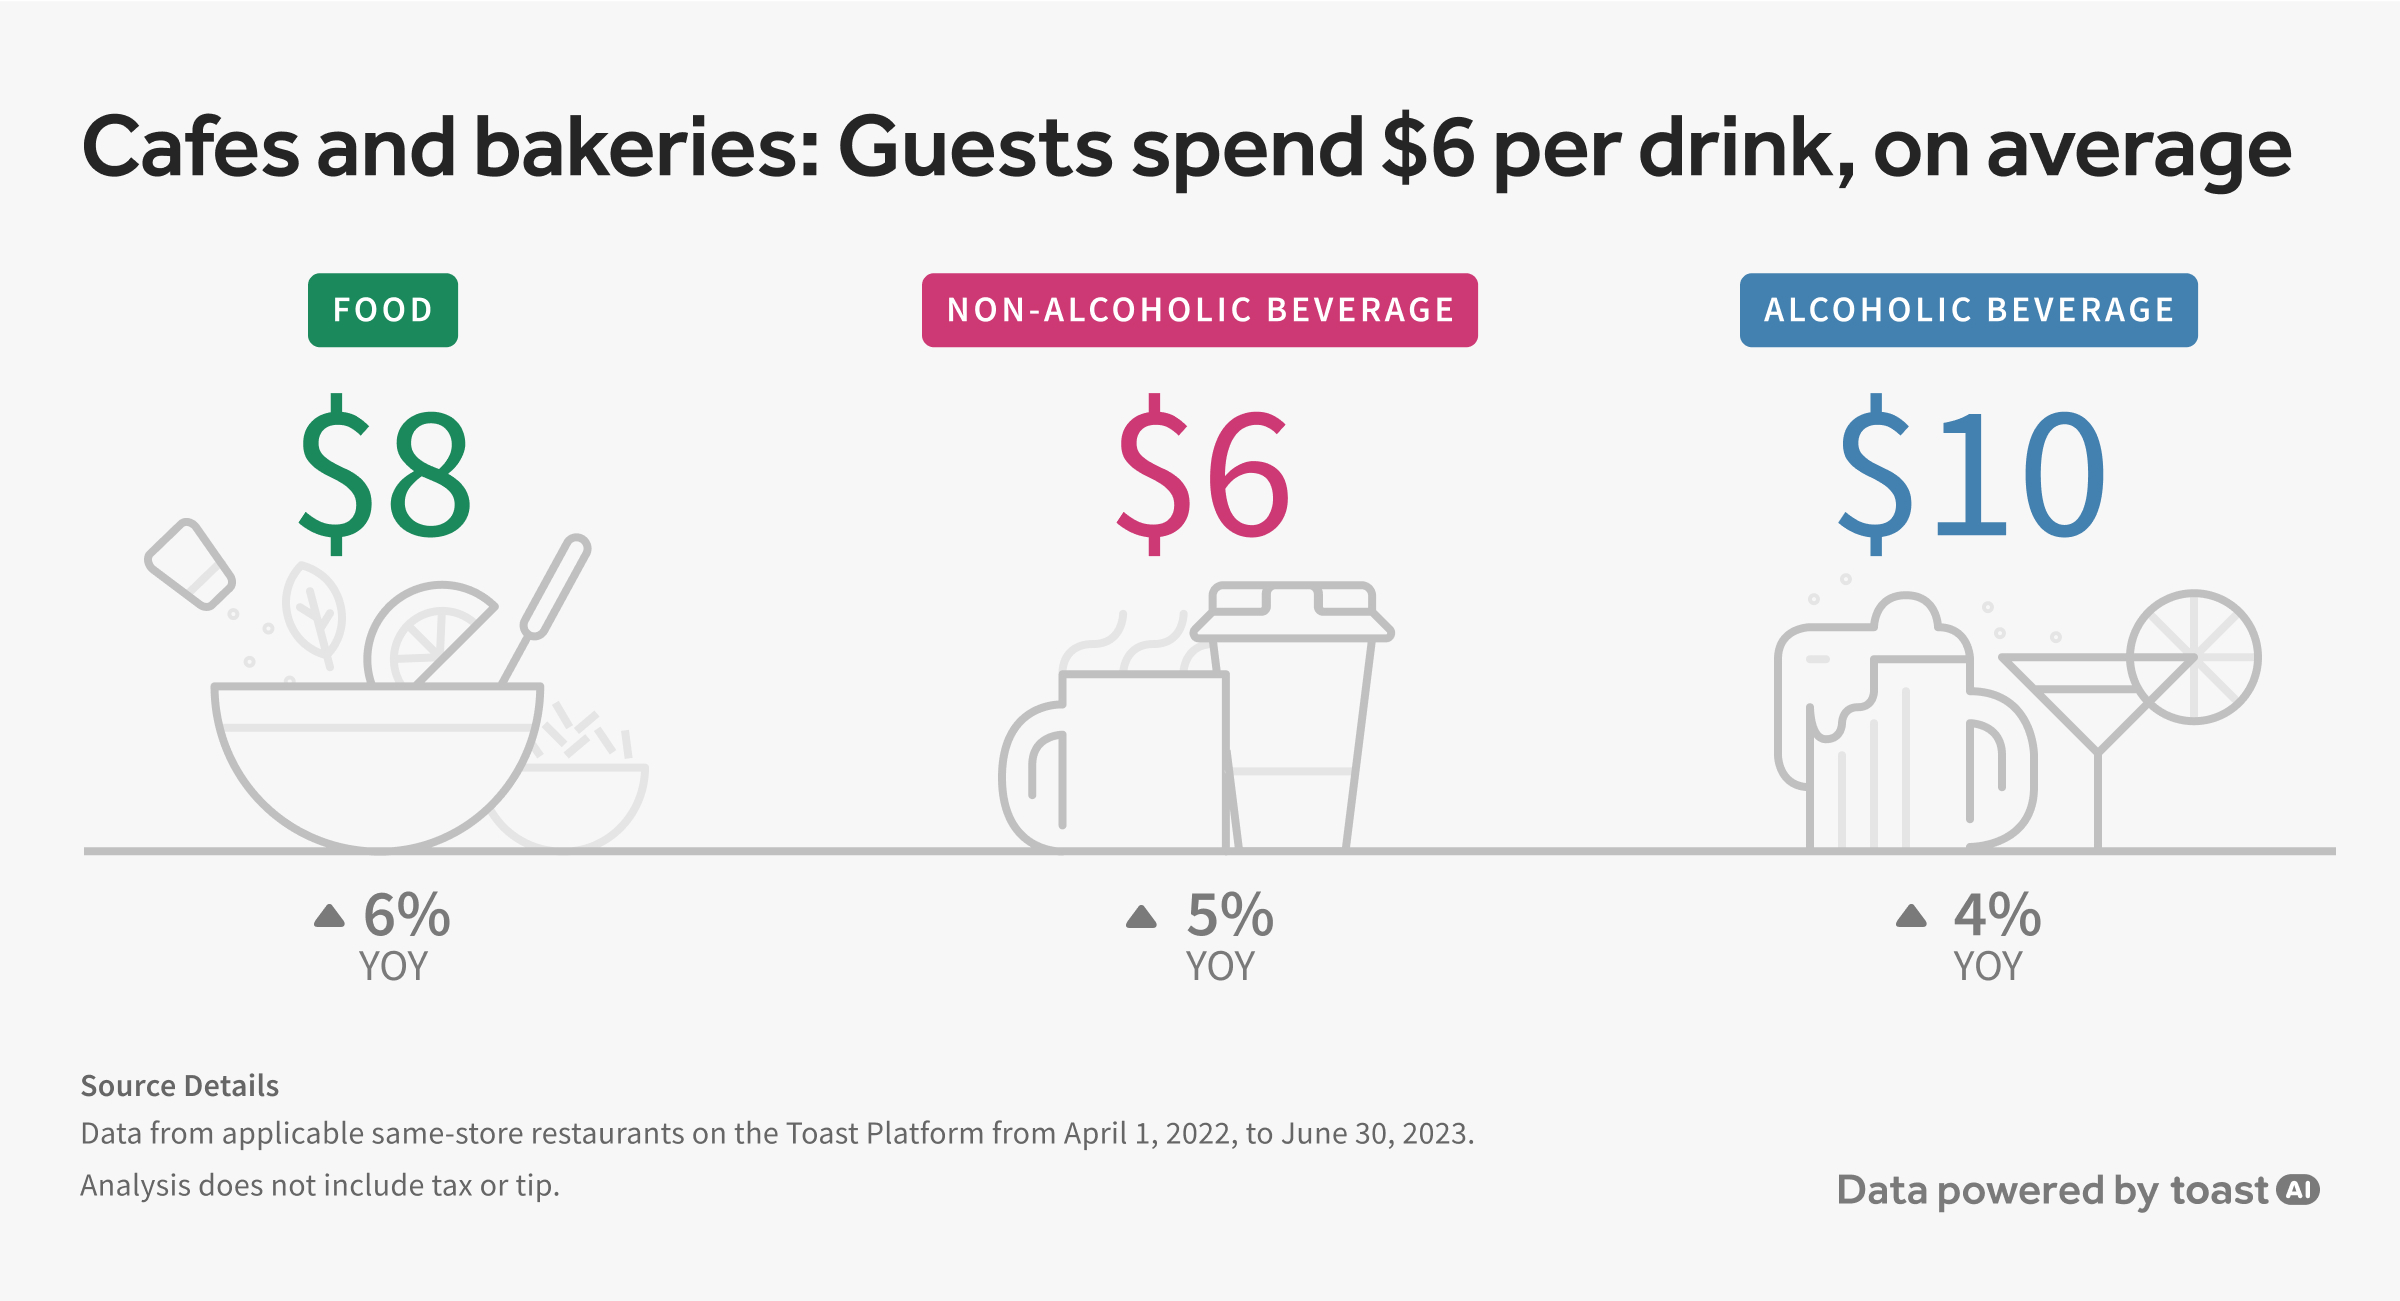
Zooming outside of the MSAs to the entire U.S. in Q2 2023, guests spent about $8 per food item at the cafes and bakeries we looked at. That’s up approximately6%, compared to spending in Q2 2022 at the same stores. Guests spent approximately $6 per beverage in Q2 2023, up 5% compared to Q2 2022. For those eateries that serve alcohol, guests spent, on average, $10 per alcoholic beverage at cafes and bakeries we looked at in Q2 2023, up about 4% from Q2 2023.3
While guests continued to get takeout and delivery, dine-in service comprised approximately 64% of transactions at cafes and bakeries we looked at in Q2 2023, up from 62% in Q2 2022. Takeout transactions dipped to 35% of transactions in Q2 2023, down from 37% in Q2 2022, while delivery was approximately 1% in both Q2 2022 and Q2 2023.3
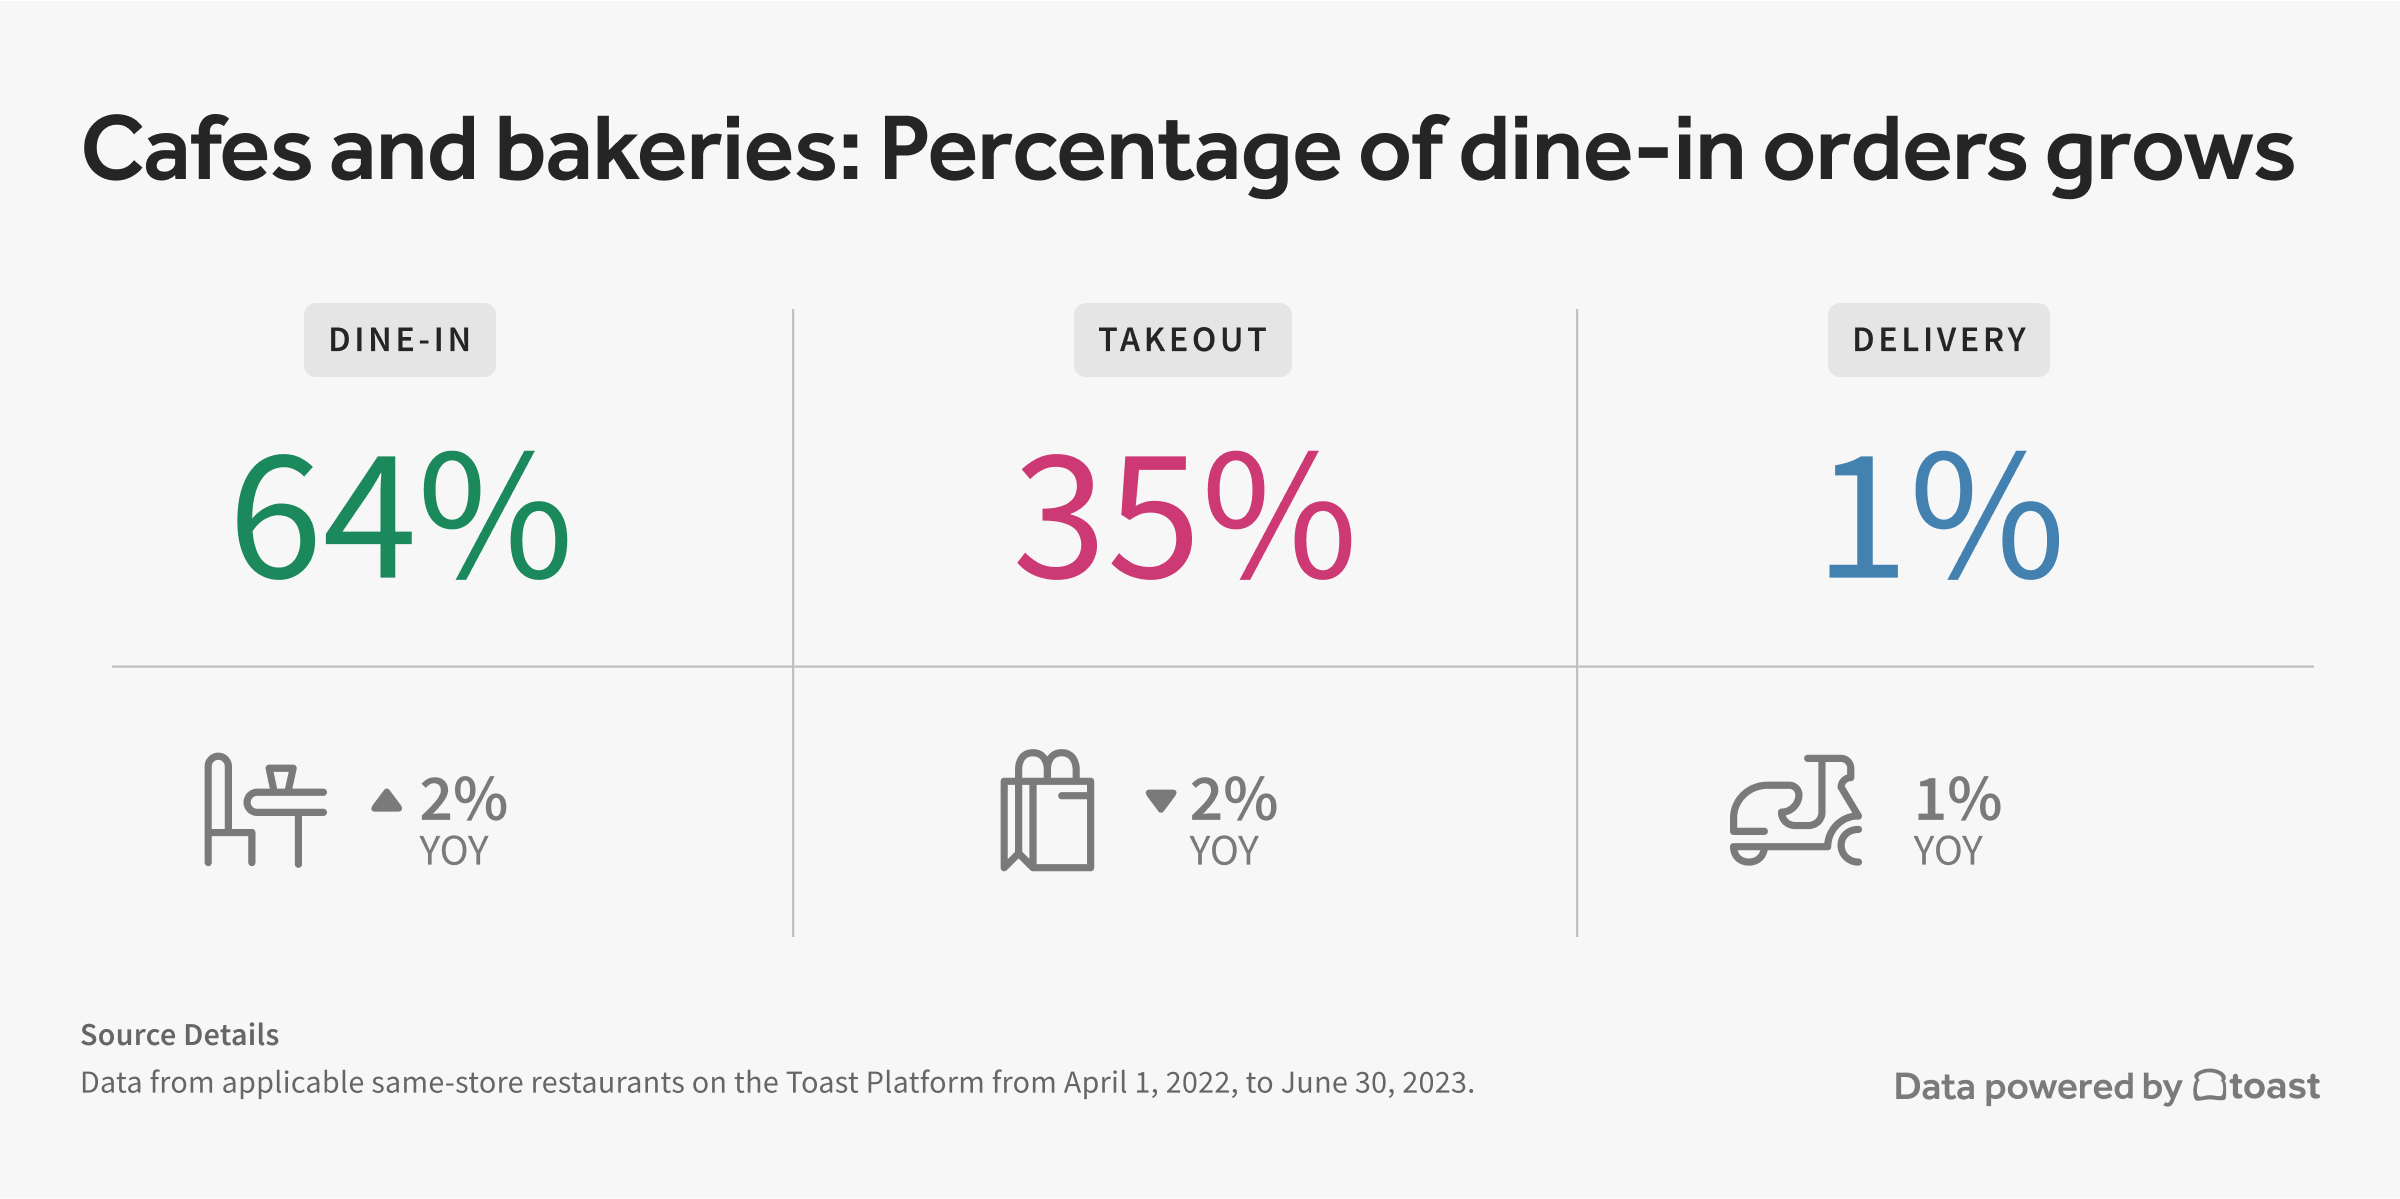
3 Methodology: Toast analyzed transactions at cafes and bakeries from a cohort of restaurants on the Toast platform in Q2 2022 and Q2 2023. Toast used a cohort of same-store customers on the platform since Q1 2022. Analysis does not include tax or tip.
So when’s the best time to visit a cafe?4
Toast analyzed transactions at cafes and bakeries over the last year and found that Monday is the slowest day, averaging about 10% fewer transactions than the weekly average. So if you’re looking for quiet time, Monday or Tuesday, which averaged about 9% fewer transactions than the weekly average, may be your best bet.
If you’re looking to spark up some conversation or people watch, the busiest days at cafes and bakeries are Saturday and Friday, averaging 15% and 9% more transactions, respectively, than the weekly average.
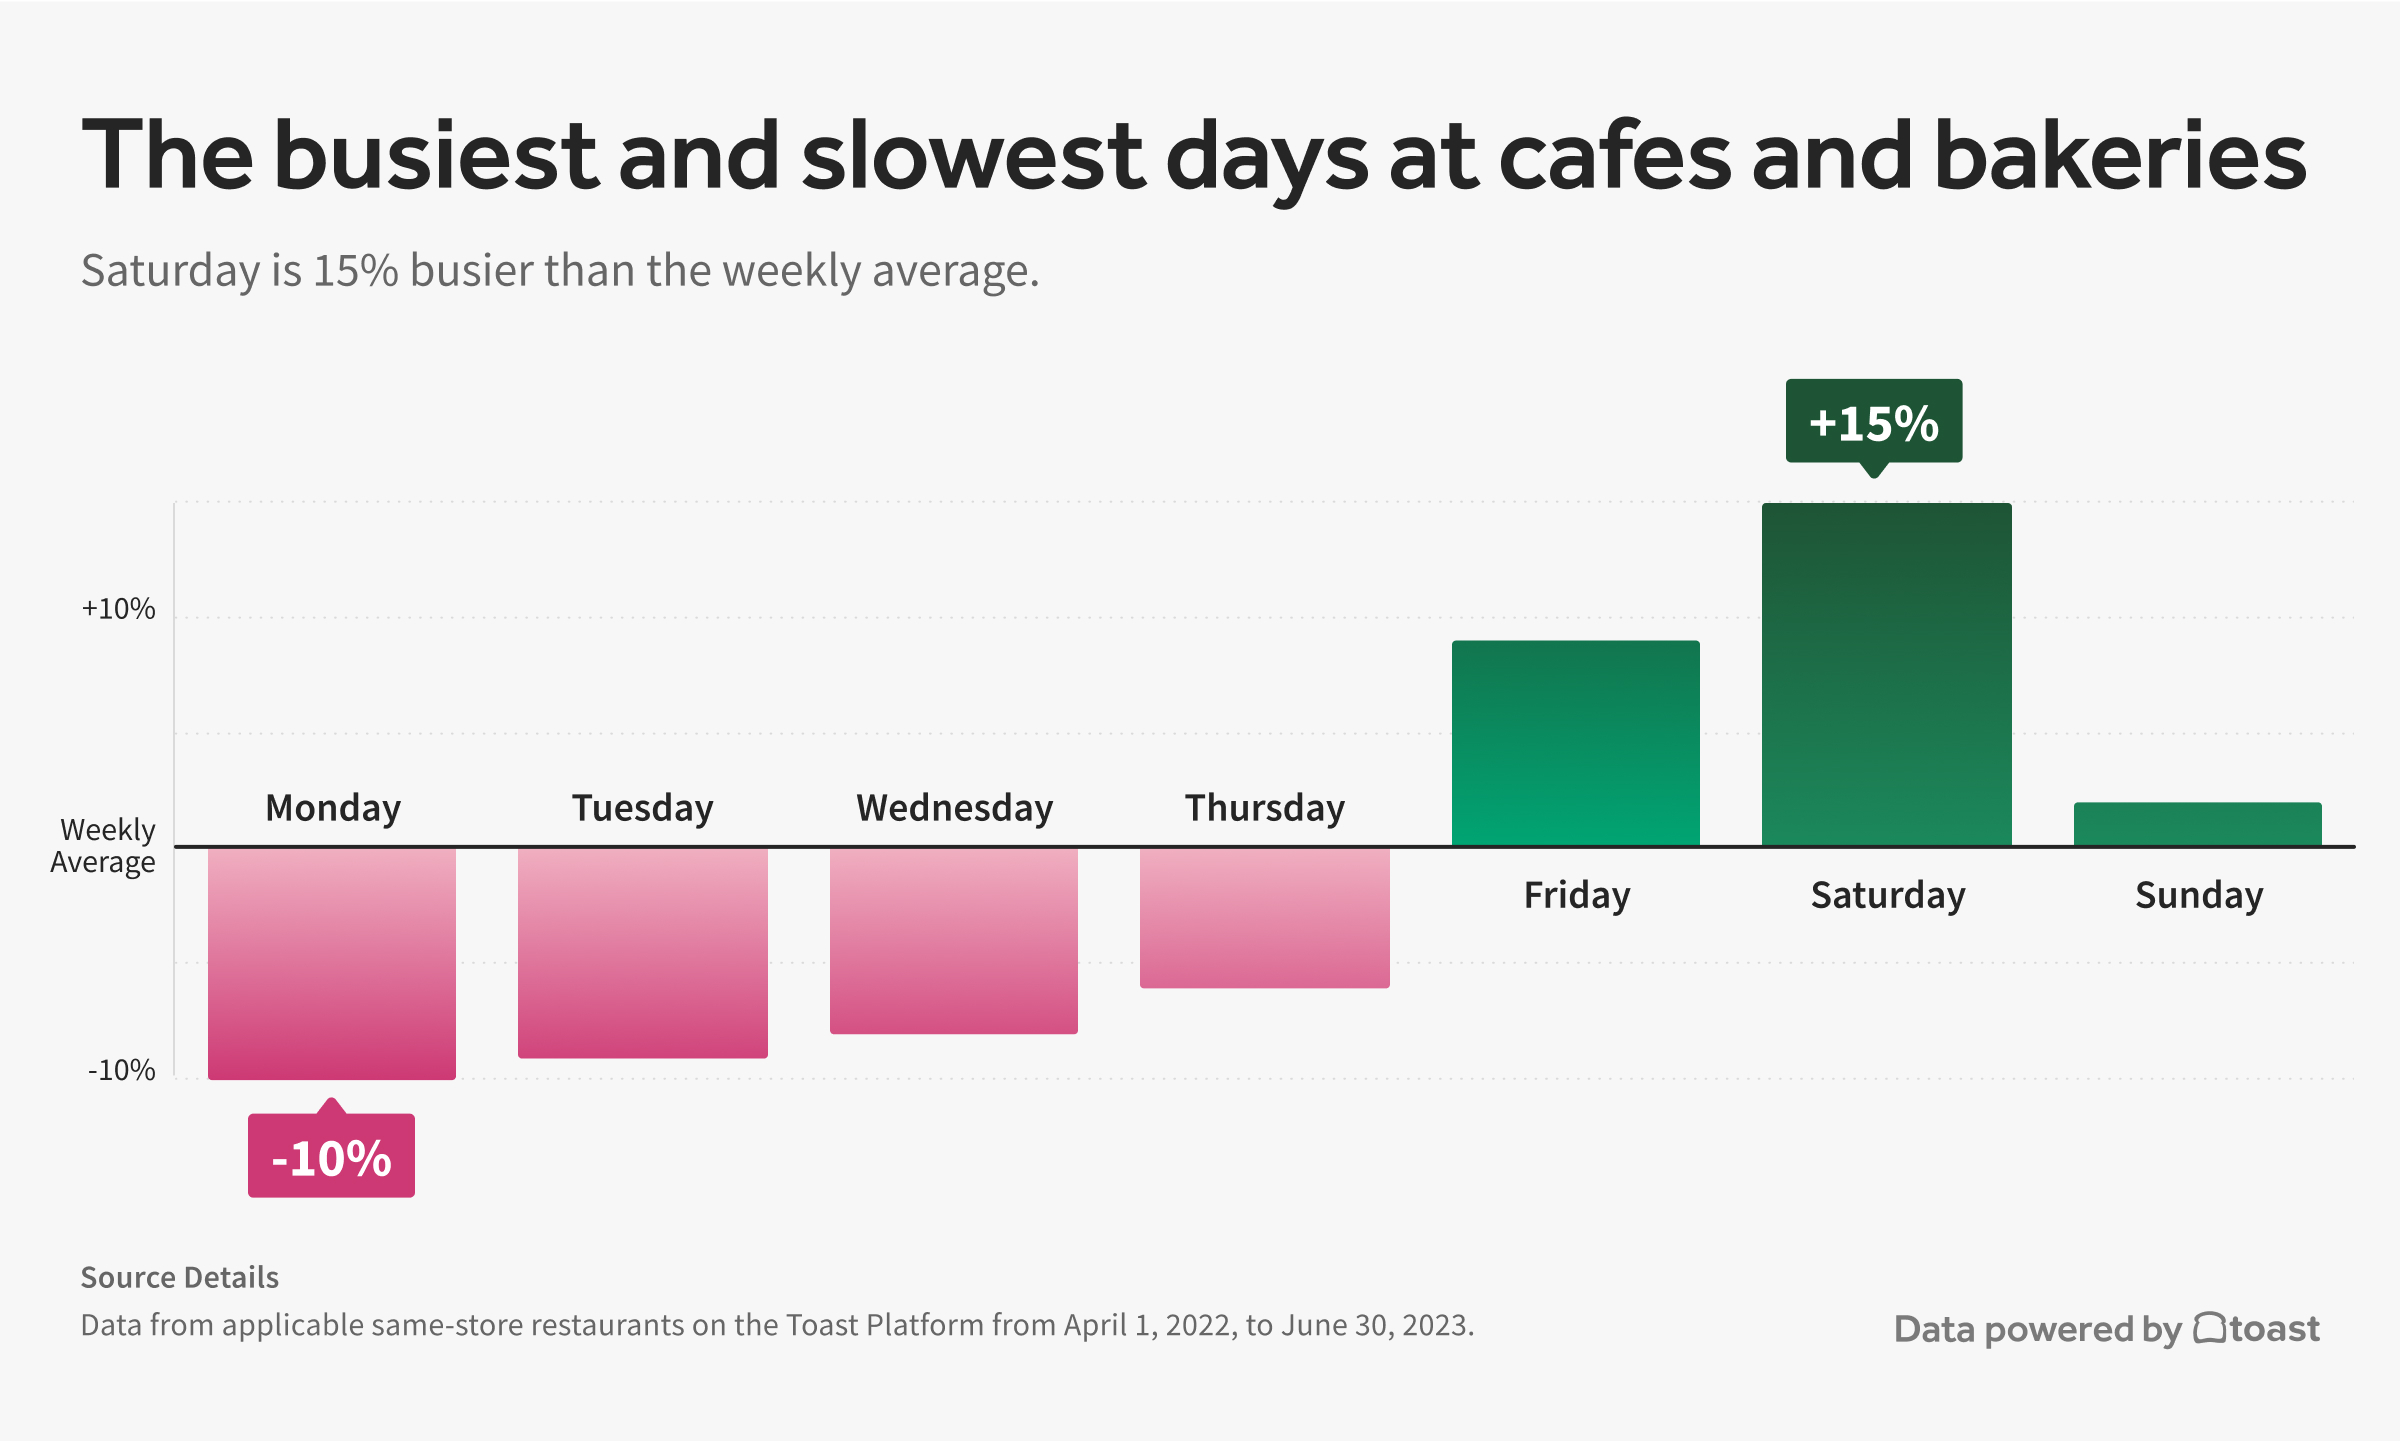
4 Methodology: Toast analyzed transactions at cafes and bakeries from a cohort of restaurants on the Toast platform from Q2 2022 to Q2 2023. Only Cafes and bakeries that processed a minimum of five transactions per day with respect to the weekday were included in this analysis to account for restaurant closures.
Burgerflation: how the cost of beef affects menu pricing for burgers
Beef prices took some big swings in the first half of 2023 due to various factors, including increased feed costs, drought in the Western U.S., as well as lingering effects of the COVID-19 pandemic that had a major impact on the meatpacking industry, the Wall Street Journal reports.
So how did that affect input costs for restaurants? Data gathered by analyzing invoices from restaurants using xtraCHEF by Toast5 suggests that ground beef prices jumped from 18% month-over-month (MoM) in April 2023 to an average price of $3.93 per pound. Things worsened for restaurants serving ground beef in May, when our data shows that ground beef prices increased an additional 6% (MoM) to a high of $4.15 per pound. Prices cooled to an average of $3.78 per pound in June, according to our xtraCHEF by Toast data, but how did those swings affect menu pricing?
Analyzing the average menu prices for a cohort of restaurants on the Toast platform for burgers indicates that restaurants generally did raise prices when ground beef costs increased but at a much lower rate. Menu prices for burgers rose less than 1% between March and June 2023 for the restaurants we looked at. While ground beef prices may fluctuate greatly, this data indicates that restaurants may be slow to raise menu prices and may choose to “eat the cost” of these types of rapid market fluctuations.
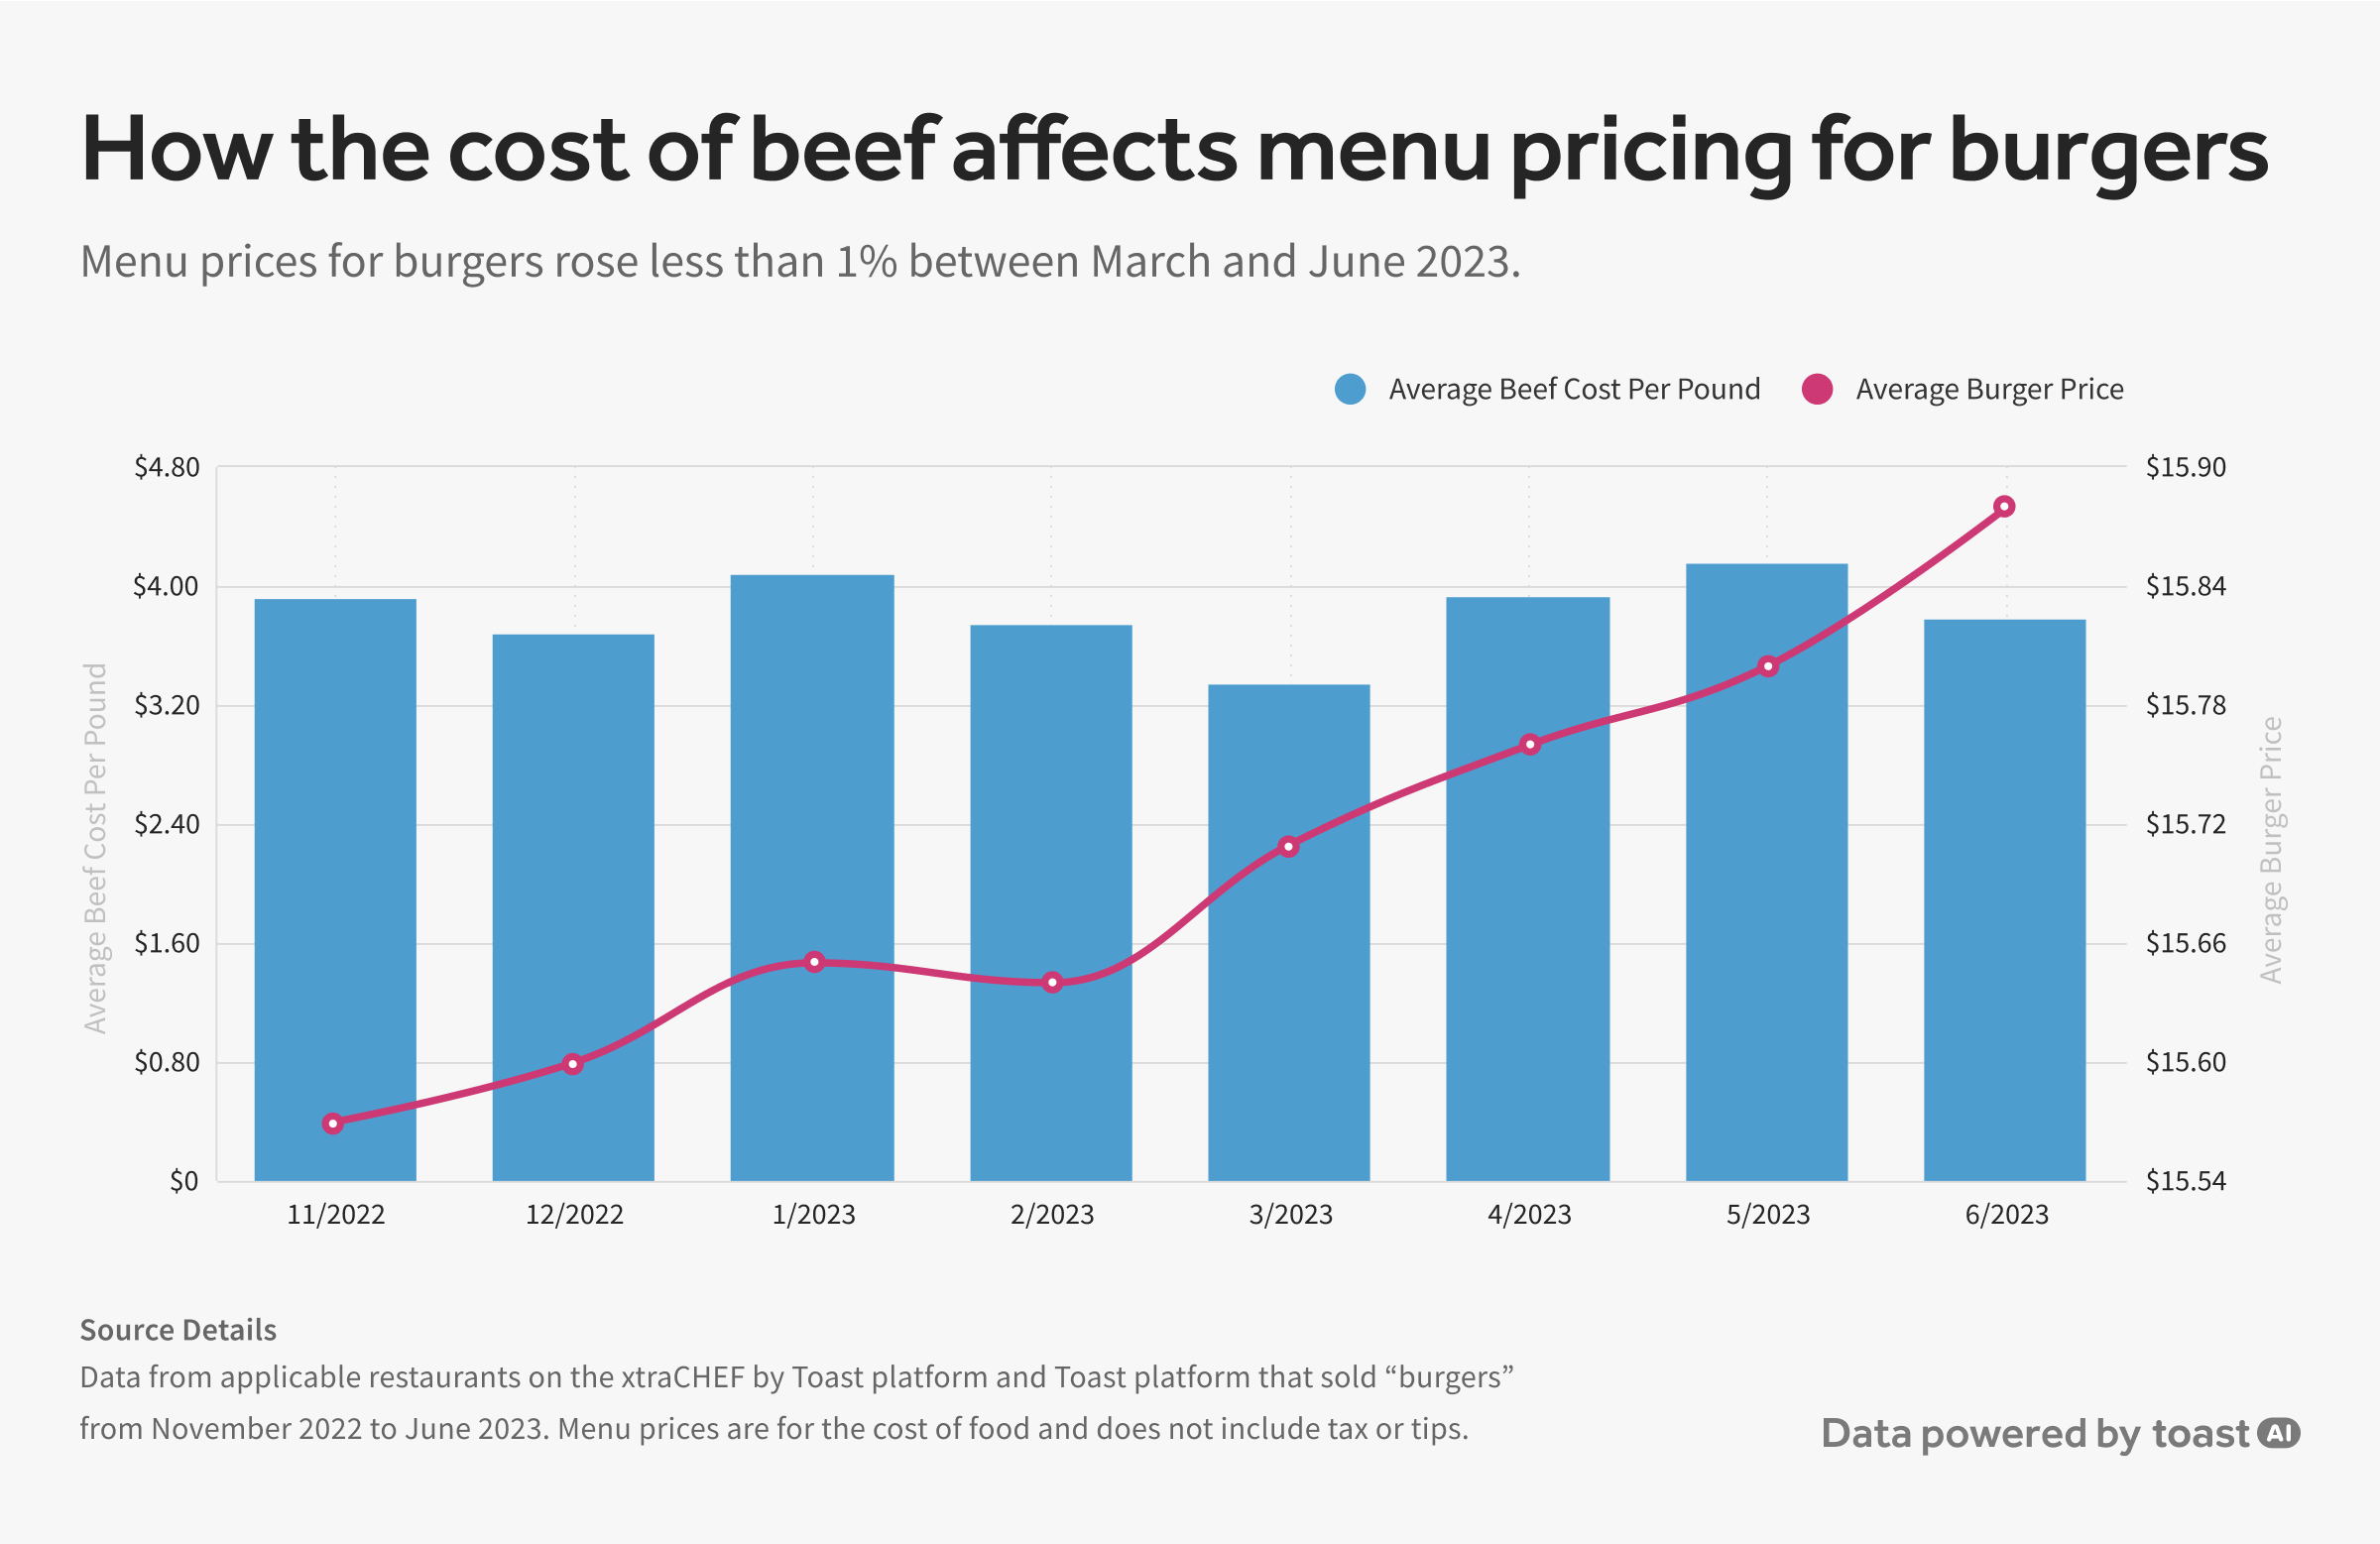
5 Methodology: Toast analyzed monthly invoice items for “ground beef” from restaurants using xtraCHEF by Toast. Items were weighted by the frequency of orders, not order quantity. Toast analyzed “burger” menu prices from a cohort of restaurants on the Toast platform from November 1, 2022, to June 30, 2023, to determine the average monthly price of burgers. The analysis only looks at the prices guests paid for burgers and does not include beverages, tax, or tips.
The state of tips in America
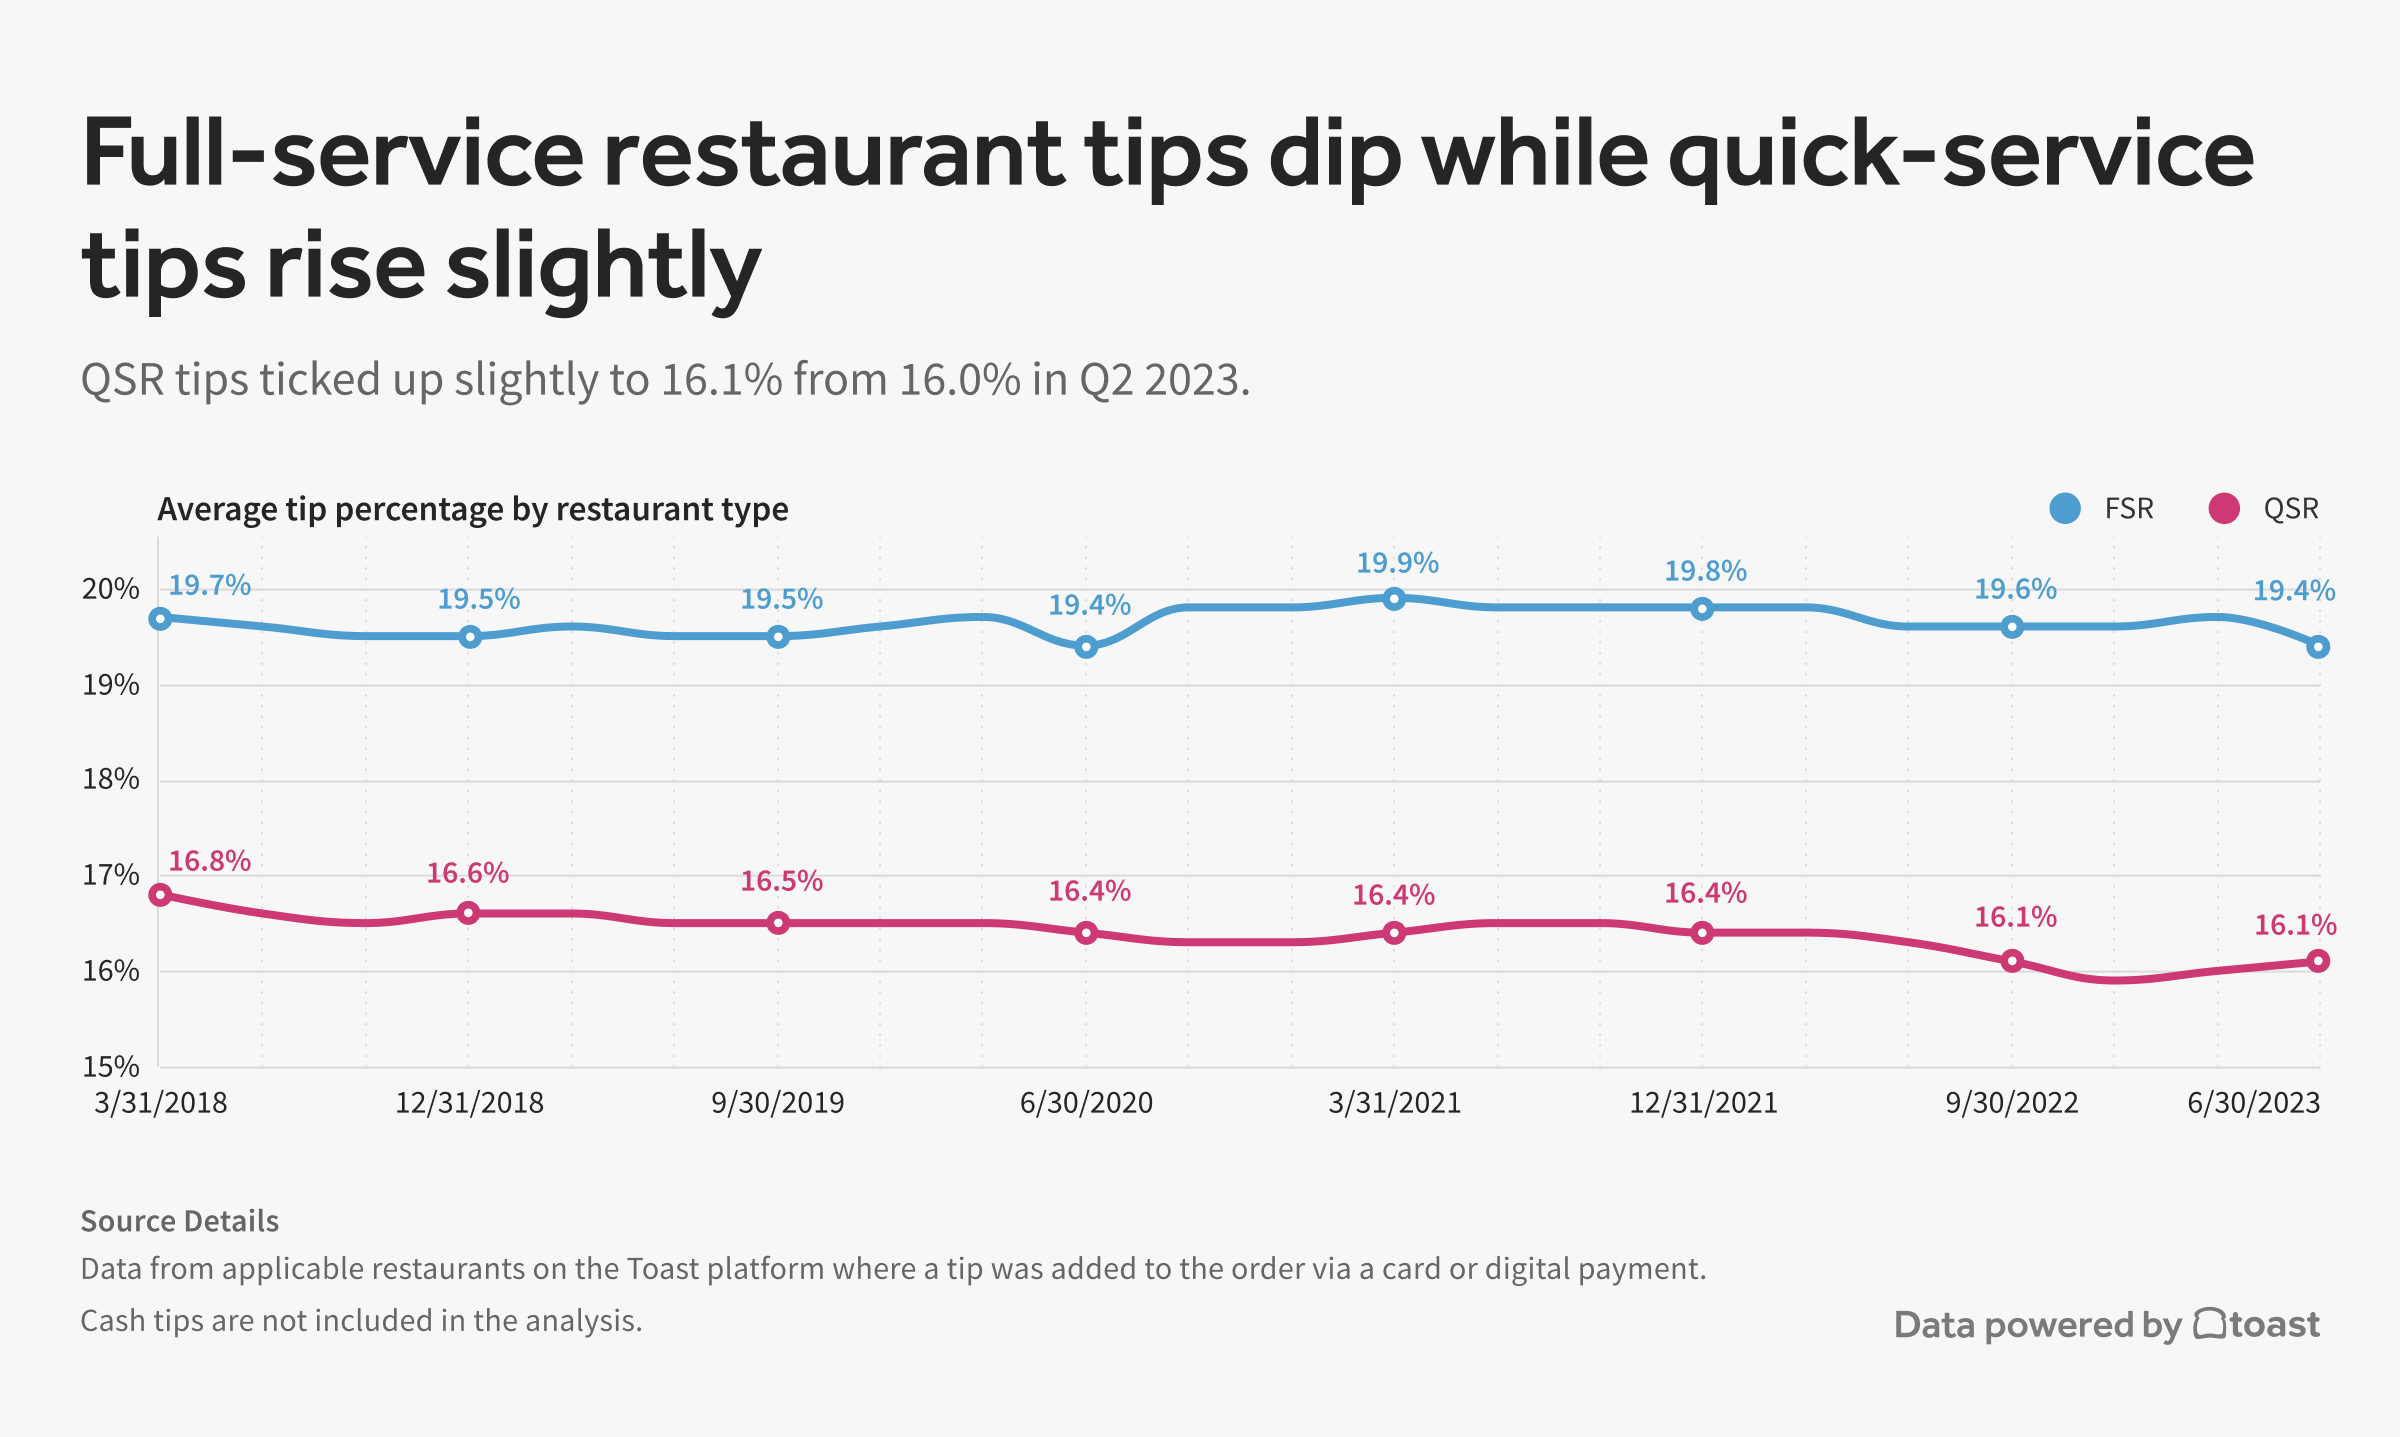
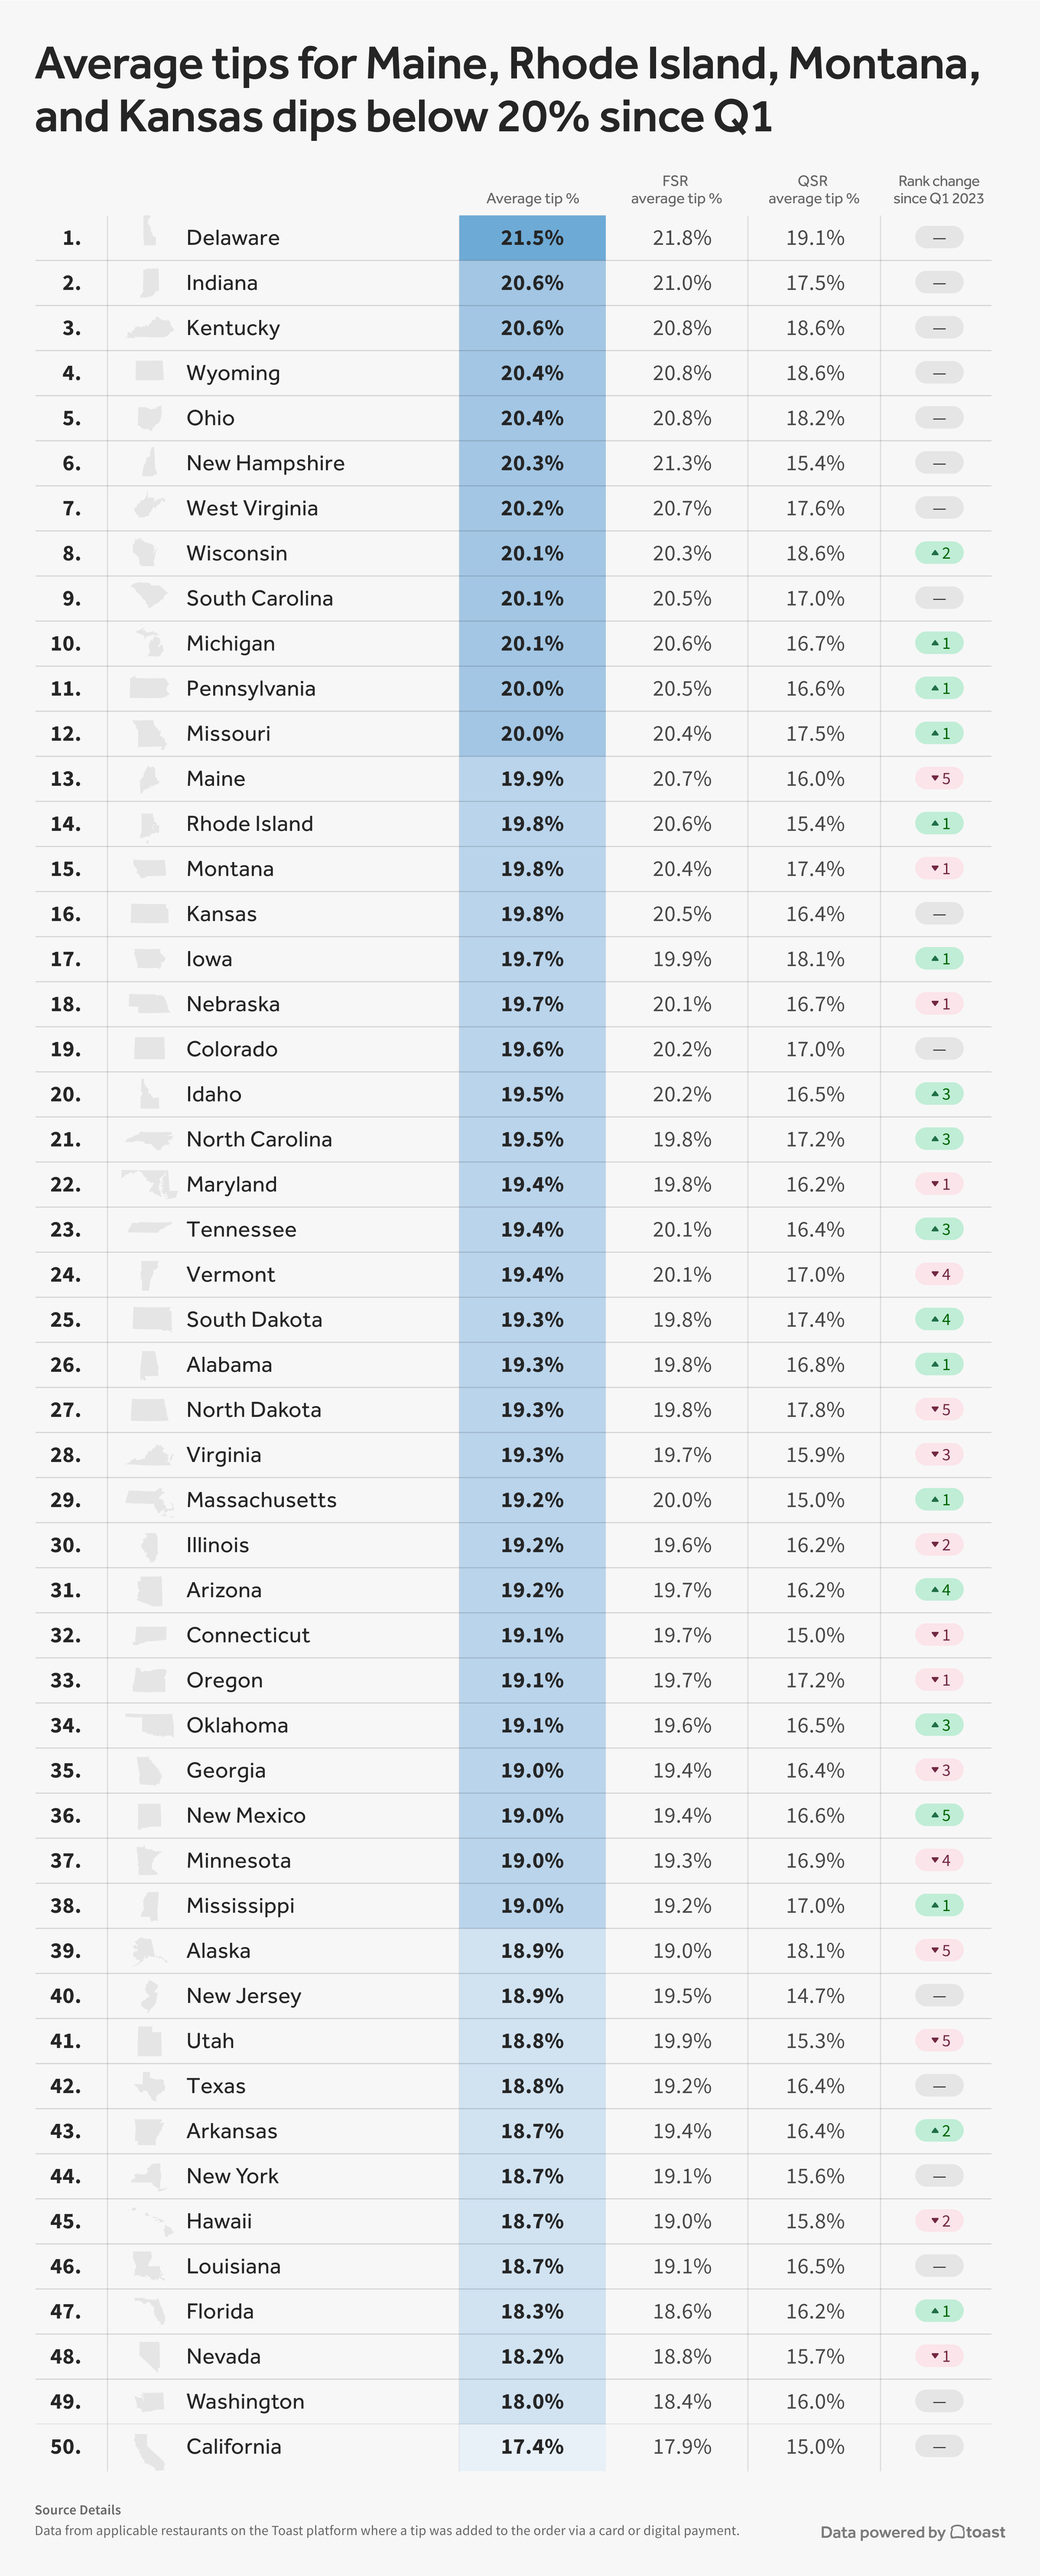
Total tips for restaurants we observed on the Toast platform averaged 18.9% of total check amounts in Q2 2023, down slightly from 19.0% in Q1 2023. Full-service restaurant (FSR) tips, where tipped employees may make a lower hourly wage in the U.S. than other types of establishments, dipped to an average of 19.4% of total check amounts in Q2 2023, down from 19.7% in Q1 2023.6
This is the lowest average tip amount for FSRs on the Toast platform since the start of the pandemic. However, quick-service restaurant tips, which our data indicates have been slowly dropping since 2018, ticked up slightly to 16.1% from 16.0% in Q2 2023.
6 Methodology: Data from restaurants on the Toast platform with tipping enabled and where a tip was added to the order via a card or digital payment. Toast compared tips from restaurants using the Toast platform from Q1 2018 to Q2 2023. Cash tips are not included in the analysis.
So what is driving this?
Industry experts point to “tipping fatigue” as a major driver, as many Americans felt pressure to tip restaurant workers more during the first few years of the COVID-19 pandemic. During this time, many businesses beyond the service industry also started asking for tips, which has become a hot topic over the last few years.
Inflation can also play a role — consumers may be less likely to dole out a big tip if they already feel strapped for cash. Other factors, like the cost of living and wage laws for tipped workers, can also factor into tipping, as well as generational divides on tipping practices and a general push for employers to pay workers a liveable wages.
Service charges instituted by a restaurant, which are becoming more common, may also have an effect on how well people tip. In recent weeks, diners in large cities like Los Angeles and Chicago have even organized to create spreadsheets tracking these fees.
6Methodology: Data from restaurants on the Toast platform with tipping enabled and where a tip was added to the order via a card or digital payment. Toast compared tips from restaurants using the Toast platform from Q1 2018 to Q2 2023. Cash tips are not included in the analysis.
About the Restaurant Trends Report:
The Restaurant Trends Report, powered by Toast, uncovers key trends across the restaurant industry through aggregated sales data from a selection of cohorts of restaurants on the Toast platform, which has approximately 93,000 locations as of June 30, 2023.
This information is provided for general informational purposes only, and publication does not constitute an endorsement. Toast does not warrant the accuracy or completeness of any information, text, graphics, links, or other items contained within this content. Individual results may vary. Toast does not guarantee you will achieve any specific results if you follow any advice herein. It may be advisable for you to consult with a professional such as a lawyer, accountant, or business advisor for advice specific to your situation. The Restaurant Trends Report is not indicative of the operational performance of Toast or its reported financial metrics, including GMV growth and same-store GMV growth.
About Toast
Toast [NYSE: TOST] is a cloud-based, all-in-one digital technology platform purpose-built for the entire restaurant community. Toast provides a comprehensive platform of software as a service (SaaS) products and financial technology solutions that give restaurants everything they need to run their business across point of sale, payments, operations, digital ordering and delivery, marketing and loyalty, and team management. We serve as the restaurant operating system, connecting front of house and back of house operations across service models including dine-in, takeout, delivery, catering, and retail. Toast helps restaurants streamline operations, increase revenue, and deliver amazing guest experiences. For more information, visit www.toasttab.com.
Contact
[email protected]
