
Data Science for Restaurants: From Numbers to Next Steps
Learn how to implement analytics, apply machine learning, and use strategies to optimize operations, boost revenue, and enhance customer experiences.

Autor
 RECURSO
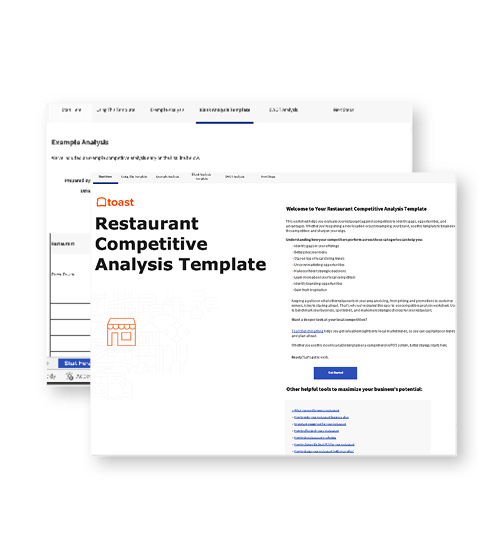
Plantilla de análisis competitivo de restaurantes
Usa esta plantilla gratuita para evaluar a tus competidores, analizar tu mercado e identificar los puntos fuertes de tu restaurante, todo en un solo lugar.
Obtener descarga gratisRestaurant data science uses sales, labor, inventory, and guest information to find patterns, forecast demand, and make more informed decisions. It can help you work out how much food to prepare, when to schedule more staff, and which menu changes to test.
Restaurants already collect much of this information, but finding a useful answer can mean working through several reports. Toast IQ lets operators ask plain-language questions about their restaurant’s sales, labor, and menu performance, making that information easier to put to work.
This guide explains which data to collect, how to use it, and how to get started.
Key takeaways
Restaurant data science helps operators forecast demand, improve menus, plan staffing, and understand guest behavior.
Reliable analysis starts with consistent sales, labor, inventory, and guest records.
Review margins, waste, and service quality alongside sales to understand whether changes actually help.
Start with one question, test a manageable change, and compare results before expanding it.
Guía de control de costos para restaurantes
Usa esta guía para obtener más información sobre los costos de los restaurantes, cómo realizarles un seguimiento y las medidas que puedes tomar para maximizar tu rentabilidad.

What is data science for restaurants?
Data science combines information with statistical methods, predictive models, and experiments to support better decisions. For restaurants, that might mean forecasting Friday’s orders or testing whether a new menu description increases sales.
Restaurant analytics helps operators understand their results, while forecasting and experimentation can help them plan and evaluate changes. Reporting, analytics, and data science overlap, but they answer different questions:
Approach | What it helps answer | Restaurant example |
Reporting | What happened? | How many sandwiches sold last Friday? |
Analytics | What patterns can we identify? | Which Friday dayparts generate the most sandwich sales? |
Data science | What might happen, or which change should we test? | How many sandwiches should we prepare next Friday? |
What data should restaurants collect?
Start with the records your restaurant already generates through orders, shifts, deliveries, and guest visits. Keep item names, categories, locations, and reporting periods consistent. If the same sandwich appears under several names, for example, its sales may be split across records.
Also distinguish revenue from profitability. A popular item can generate substantial sales without contributing much after ingredient costs. Toast Reporting + Analytics helps operators review sales, product mix, labor, and performance across periods or locations.
Data category | What to collect | What it can inform |
Sales and orders | Items, quantities, prices, discounts, ordering channels, and timestamps | Demand forecasts and menu decisions |
Labor | Hours, roles, pay rates, and shift coverage | Staffing and labor planning |
Purchasing and inventory | Supplier costs, recipes, stock counts, and recorded waste | Purchasing, prep, and food-cost control |
Guest activity | Visit frequency, purchase history, and offer redemption | Retention and relevant marketing |
Service | Ticket times, errors, refunds, and feedback | Workflow improvements |
How can restaurants use data science?
Restaurant data is useful when it informs a specific decision. That could mean adjusting prep quantities, changing shift coverage, or testing a more relevant guest offer.
1. Forecast demand and prepare for busy periods
Demand forecasting uses past activity and relevant conditions to estimate upcoming business. A useful forecast helps the team prepare enough food and supplies without treating every shift as equally busy.
Find recurring patterns: Compare similar weekdays, dayparts, and seasons.
Account for exceptions: Consider holidays, nearby events, promotions, and unusual weather.
Plan purchasing and prep: Translate expected orders into ingredient and production needs.
Check forecast accuracy: Compare predictions with actual results and adjust.
Separate volume from revenue: Higher prices can increase sales dollars without increasing the number of meals served.
For example, an ordinary Friday and a Friday with a concert next door may require different prep quantities. Reviewing similar event nights gives the manager a more useful starting point than simply repeating last week’s plan.
2. Improve menu decisions
Menu performance involves more than identifying bestsellers. Operators also need to understand ingredient costs, contribution margin, and how items fit into the rest of an order. Menu engineering connects those measures so restaurants can make more informed decisions about what to feature, adjust, or investigate.
Compare popularity and margin: Review both quantity sold and the dollars remaining after ingredient costs.
Look for common pairings: Identify beverages, sides, and add-ons frequently purchased together.
Test manageable changes: Try a clearer description, different placement, or a relevant bundle.
Evaluate the whole result: Track quantities and margin, including whether sales shifted away from another item.
A 2025 Toast and Coca-Cola pilot illustrates the value of testing menu changes. Optimizing beverage names, images, and descriptions produced a 15% increase in Coca-Cola beverage sales through Toast Online Ordering. That result applies to the pilot’s beverage sales, not overall restaurant revenue. The broader lesson is to test a specific change and measure what happens.
3. Match staffing to demand
Staffing decisions become clearer when expected orders and service needs are considered alongside labor costs. The goal is appropriate coverage, not simply fewer scheduled hours.
Restaurant Business reported that BJ’s Restaurant & Brewhouse uses historical sales, weather, and local events to forecast demand two weeks ahead and help managers build schedules. “Sales forecasting is so data-driven, and that’s what AI can do,” BJ’s chief information officer Brian Krakower told the publication.
Plan by daypart and role: Match coverage to expected orders, preparation, and service responsibilities.
Compare scheduled and actual hours: Investigate overtime, coverage gaps, and forecasting errors.
Watch service alongside cost: Check whether ticket times or guest complaints rise when coverage changes.
Keep managers involved: Account for employee availability, training needs, and unusual circumstances.
Toast’s employee scheduling tools help connect sales forecasts and projected labor costs with schedule planning, giving managers more information before shifts begin.
4. Reduce overordering and food waste
Sales show what guests purchased, but they don’t explain everything that happened to the ingredients. Purchasing records, recipes, physical counts, and waste logs help fill those gaps.
Record waste consistently: Use a restaurant waste log to capture the item, quantity, reason, and timing.
Compare prep with demand: Look for items that are repeatedly overproduced.
Adjust purchasing: Consider shelf life, supplier lead times, and expected sales.
Investigate discrepancies: Check portions, recipes, receiving records, and counts before assuming a cause.
Protect availability: Track stockouts alongside waste reductions so lower waste doesn’t come at the expense of guest orders.
xtraCHEF by Toast connects invoice information, ingredient costs, recipes, and inventory analysis, helping operators understand where purchasing and production decisions need attention.
5. Make guest marketing more relevant
Guest data can help restaurants understand who returns, what they order, and which offers may interest them. Different groups may respond to different rewards.
Toast’s loyalty return-rate analysis found a 20% return rate within 90 days for fine-dining guests using item-based rewards, compared with 13% for cashback rewards. The finding shows an association, not proof that the reward type caused the difference.
Group guests meaningfully: Consider visit frequency, preferences, and ordering channels.
Match the offer to the guest: Make recommendations relevant to previous purchases or behavior.
Measure repeat activity: Track return visits and spending after a campaign.
Account for discount costs: A redeemed offer doesn’t necessarily produce additional profit.
Use comparison groups when practical: Compare similar guests who received an offer with those who did not.
Toast Guest CRM brings guest activity together, helping restaurants build useful segments and make outreach more relevant.
6. Find service problems sooner
A restaurant-wide average can hide a problem affecting one shift, station, or ordering channel. Breaking results into smaller groups helps operators see where to investigate.
For example, delivery orders might take longer during the dinner rush even when overall ticket times look acceptable. Comparing order volume, kitchen timing, and guest feedback can help the team determine what needs to change.
Compare ticket times: Identify when and where orders slow down.
Review refunds and voids: Look for recurring patterns that need attention.
Add guest feedback: Use comments to understand what transaction records cannot explain.
Test one workflow change: Compare results before expanding it.
Investigate before concluding: An unusual pattern doesn’t establish its cause or indicate employee misconduct.
How to get started with restaurant data science
Start with a decision you already need to make, rather than trying to analyze the entire restaurant at once. A focused question makes it easier to collect the right information and recognize a useful result.
White Castle took that approach when testing its Impossible Slider in selected locations before expanding. CEO Lisa Ingram told Restaurant Business: “You lessen the risk when you start in a smaller environment and vet the idea. Test, learn, and iterate.”
Choose one question: For example, are you preparing too much of a particular item?
Define success: Select relevant restaurant performance metrics, including safeguards such as stockouts or service times.
Check the records: Resolve inconsistent categories, missing information, and inaccurate counts.
Establish a baseline: Compare equivalent shifts or periods so the starting point is meaningful.
Test a manageable change: Limit the initial scope to one item, shift, or location.
Account for outside factors: Note price changes, promotions, weather, and events that could affect results.
Review and adjust: Keep what works, investigate unexpected results, and revise the next test.
Protect sensitive information: Limit access to guest and employee records to people who need it.
Put your restaurant’s data to work
Your restaurant collects useful information every day. The opportunity is to connect what it tells you with decisions about the next shift, menu update, or purchase.
Toast IQ helps make that connection. Ask questions about sales, labor, and menu performance in plain language, then use the answers to decide what needs attention. You can spend less time searching through reports and more time putting what you learn into practice.
Calculadora de margen de ganancia para restaurantes
Esta calculadora gratuita de margen de ganancia para restaurantes te ayudará a determinar con qué nivel de eficiencia estás transformando tus ingresos por ventas en ganancias.
FAQ
What types of data should restaurants collect for data science applications?
Restaurants should collect sales, order details, employee hours, labor costs, purchasing records, inventory counts, waste logs, guest activity, and service data.
How can small restaurants implement data science without large budgets?
Small restaurants can start with existing POS reports and spreadsheets, choose one question about prep, staffing, or menu performance, and test a small change.
What are the most important metrics for restaurant data science?
Useful metrics include order volume, item sales, contribution margin, labor cost percentage, food waste, stockouts, ticket times, and guest return rates.
How long does it take to see results from restaurant data science implementation?
Operational changes can be reviewed over comparable shifts or weeks, while guest retention and seasonal patterns require longer observation.
What are common challenges in restaurant data science implementation?
Common challenges include inaccurate or disconnected records, inconsistent item names, limited historical data, and difficulty separating the effects of a change from factors such as promotions or seasonality.
How does data science improve restaurant customer experience?
Data science can help restaurants match staffing and prep to demand, reduce stockouts, identify service delays, and offer more relevant recommendations and rewards.


¿Es útil este artículo?
AVISO LEGAL: Esta información se proporciona solo con fines informativos generales y su publicación no constituye un aval. Toast no garantiza la precisión ni la integridad de la información, el texto, los gráficos, los enlaces y otros elementos que incluye este contenido. Toast no garantiza que alcanzarás ningún resultado específico si sigues los consejos que aparecen aquí. Te recomendamos consultar con un profesional, como un abogado, contador o asesor comercial, para recibir asesoramiento específico para tu situación.
 Tendencias


Subscribe to On the line
Sign up to get industry intel, advice, tools, and honest takes from real people tackling their restaurants' greatest challenges.
Al enviar, aceptas recibir correos electrónicos de marketing de Toast. Trataremos tu información de acuerdo con nuestra declaración de privacidad. Información adicional disponible para residentes de California aquí.