
Beer Prices at Bars and Restaurants in 2026
Setting beer prices starts with knowing your costs and market. Explore Toast’s latest data, regional differences, and pricing trends.

Autor
 RESOURCE
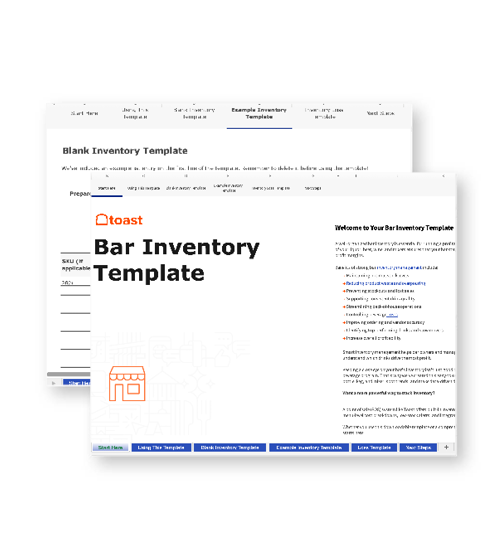
 Bar Inventory Template
Use this free bar inventory template to help your bar stay organized, track your stock accurately, and manage your beverage costs with ease.
Obtener descarga gratisThe median beer price at Toast restaurants was $6.61 in July 2026, up 2.5% from a year earlier, according to Toast’s beer pricing data. That provides a useful national benchmark, although it doesn’t represent a standardized pint or the price every bar charges.
For operators, the next question is how their own prices compare—and whether those prices support the business. Toast’s bar POS system connects menu prices with beverage sales, making it easier to see what guests buy and how pricing changes affect results.
Here’s how beer prices differ across the country, how they’ve changed, and how to use those numbers when pricing your menu.
Key takeaways
Toast’s median restaurant beer price reached $6.61 in July 2026, up 2.5% year over year and 0.2% from June.
In March 2026, New York City had the highest median beer price among cities Toast examined at $9.16, versus $5.99 in San Antonio.
Hawaii led state median beer prices at $8.00 in March 2026, followed by New York at $7.97 and California at $7.96.
New Mexico recorded the largest annual state price increase at 4.8% in March 2026, followed by South Carolina at 4.2% and Montana at 4.0%.
Toast’s pricing data provides market benchmarks, while a bar’s own costs and sales determine which menu prices work.

How do beer prices vary across the country?
Toast’s March 2026 state and city beer-pricing report found median beer prices of $9.16 in New York City and $5.99 in San Antonio—the highest and lowest among the cities examined. That’s a $3.17 difference, showing why one national number can’t describe every local market. The analysis also identified differences in statewide prices and annual increases:
Highest-priced states: Hawaii led at $8.00, followed by New York at $7.97 and California at $7.96.
Fastest price increases: New Mexico recorded a 4.8% annual increase, followed by South Carolina at 4.2% and Montana at 4.0%.
These figures reflect March 2026 medians from applicable full-service restaurants and bars. The city comparison covers the markets Toast examined, not every U.S. city.
For a bar owner, the takeaway is straightforward: compare your menu with similar local venues before deciding that a beer is underpriced or overpriced. A specialty pour at a full-service restaurant is a different purchase from a domestic bottle at a neighborhood bar.
How have beer prices changed?
Beer prices increased gradually over the past year. The national median rose from $6.45 in July 2025 to $6.61 in July 2026, according to Toast’s beer pricing report.
Month | Median beer price |
July 2025 | $6.45 |
January 2026 | $6.48 |
July 2026 | $6.61 |
Two changes put that movement in context:
Over the year: The median increased by $0.16, with Toast reporting 2.5% annual growth.
Most recently: Prices increased 0.2% from June to July 2026.
The Toast Menu Price Monitor tracks these changes monthly using restaurant sales data. Each month represents a snapshot of applicable locations, rather than an identical group of venues followed over time.
Use the trend as context, not an instruction to raise prices. Your supplier costs, sales volume, and guests’ response matter more than matching a national percentage.
Plantilla de hoja de inventario de PAR
Realiza fácilmente un seguimiento de tu inventario con la ayuda de esta plantilla de hojas de inventario de PAR personalizable.
What affects the price of beer?
A beer’s menu price needs to cover more than the liquid in the glass. Purchasing, packaging, serving, and operating costs all influence what a bar can charge.
Purchasing costs: Domestic wholesale draft-beer prices rose approximately 15% between January 2020 and December 2025, according to Axios’s analysis.
Production choices: Brewers can adjust how they package products to manage expenses. Associated Press reporting described Fat Head’s Brewery switching to painted cans because they cost less than cans with shrink-wrapped sleeves.
Packaging: In a February 2025 CNN interview, Brewers Association president and CEO Bart Watson said roughly 75% of packaged craft beer went into cans. He explained that switching to bottles also requires different equipment, limiting how quickly brewers can change packaging.
Beer selection and serving size: Brand, style, and quantity affect both purchasing costs and what guests receive. Compare equivalent servings before judging two prices.
Draft yield and upkeep: Keg costs need to be spread across the servings a bar can actually sell. Foam, spills, samples, refrigeration, and line maintenance affect the economics of draft service.
Venue and local market: Staffing, premises, service, and guest expectations influence the final price. Two bars buying the same beer may have different expenses to cover.
How to use beer pricing data to set your menu prices
National data can help you assess the market, but bar menu pricing starts with your own costs. A useful price must make sense to guests while leaving enough money to support the operation.
1. Calculate your cost per serving
Start with what each sellable beer costs you. Bottles and cans are relatively straightforward; draft beer requires a realistic estimate of keg yield.
Bottles and cans: Divide the case cost by the number of sellable units.
Draft beer: Divide the keg cost by the number of servings you realistically expect to sell.
Pour size: Calculate each serving size separately.
Waste: Account for foam, spills, samples, and inconsistent pours instead of assuming every ounce becomes a sale.
Toast Inventory Management combines inventory, invoice, and POS sales information to support inventory valuation and actual-versus-theoretical reporting. That helps operators investigate differences between expected usage and what inventory records show.
2. Calculate a starting selling price
Once you know the serving cost, divide it by your target beverage cost percentage:
Serving cost ÷ target beverage cost percentage = starting selling price
For example, a bottled beer costing $1.50 with a 25% cost target would have a starting price of:
$1.50 ÷ 0.25 = $6.00
Choose a workable target: Consider your service model, other expenses, and guests’ expectations.
Distinguish margin from profit: A 25% beer cost leaves 75% of the selling price before labor, rent, and other expenses.
Update the inputs: A price calculated from an old supplier invoice may no longer accurately reflect current costs.
xtraCHEF by Toast digitizes supplier invoices and tracks price changes, helping operators keep the purchasing costs behind these calculations current.
Herramienta de comparación de puntos de venta (POS) para bares y lounges
Una herramienta gratuita de comparación de POS para bares y lounges, que permite investigar y comparar sistemas de puntos de venta en una hoja de Excel.
3. Compare your price with the right benchmarks
The national median is a starting reference, not a price ceiling or floor. Compare what guests receive and the setting in which they receive it.
Match the product: Compare similar brands or styles.
Match the quantity: Check the serving size, not just the price.
Match the experience: Look at venues with comparable service and positioning.
Separate promotions: Compare regular prices separately from happy-hour or event offers.
Consider demand: A higher price only helps if enough guests still choose the product.
Toast Benchmarking adds aggregated peer comparisons of item pricing, sales, and volume. Operators can define comparison groups without accessing individual competitors’ results; insights depend on sufficient data being available.
Lista de verificación de equipos para bares
¿Estás por abrir o renovar un bar? ¡Que no te falte ningún equipo esencial! Descarga nuestra lista de verificación de equipos para bares gratuita.
4. Review margin dollars alongside sales
A lower beverage cost percentage doesn’t automatically produce a stronger beer program. The dollars each sale leaves behind—and how many units sell—matter too.
A hypothetical $6 beer costing $1.50 leaves $4.50 before other expenses. That amount becomes more useful when considered alongside sales volume, discounts, and waste.
Units sold: Check whether demand changes after a price adjustment.
Realized selling price: Account for discounts rather than relying only on the listed price.
Cost changes: Review whether supplier increases have reduced the amount left from each sale.
Actual usage: Compare purchasing and inventory records with beer sales.
For a period-level view, apply the principles of calculating beverage cost:
Beer cost percentage = [(Beginning beer inventory + Beer purchases − Ending beer inventory) ÷ Beer sales] × 100
Use inventory values, purchases, and sales from the same period. This measures actual beer usage rather than the estimated cost of one serving.
Toast Reporting + Analytics provides product-mix reporting and comparisons across periods, helping operators evaluate sales after a pricing change. Pair those results with purchasing and inventory records to understand the effect on margins.
Keep beer pricing connected to performance
The right beer price needs to work for both the guest and the bar. National and local figures help you understand the market, while your own purchasing costs and sales show whether the menu is doing its job.
Toast Point of Sale keeps menu prices, orders, and reporting connected, while cost and inventory tools across the platform add purchasing context. Together, that information makes it easier to see when a price needs attention—and when changing the beer selection or reducing waste could make a bigger difference.
Usa esta plantilla gratuita para describir fácilmente todos tus procedimientos operativos y lograr que las operaciones diarias sean tan uniformes como sea posible.
FAQ
Why does the same beer cost different amounts at different bars?
Bars have different rent, staffing, purchasing costs, and service levels, so they may charge different prices for the same beer.
Are beer prices higher on weekends?
Beer prices are not automatically higher on weekends, but weekday specials, happy-hour discounts, or event pricing can change what you pay.
What's a reasonable price for a craft beer?
A reasonable craft beer price depends on the style, serving size, and local market; Toast’s $6.61 median beer price for July 2026 provides context but is not a craft-beer-specific benchmark.
Is draft beer cheaper than bottles?
Draft beer may cost a bar less per serving, but waste, equipment upkeep, and menu pricing mean it is not necessarily cheaper for guests.
How much should I budget for a night out?
Check the venue’s menu and add up your planned drinks, food, transportation, any cover charge, and applicable taxes and tips rather than relying on a national beer-price average.
Do bars charge more for high-ABV beers?
Some bars charge more for high-ABV beers or serve them in smaller glasses, but the price also depends on the beer’s style, brand, and production costs.


¿Es útil este artículo?
AVISO LEGAL: Esta información se proporciona solo con fines informativos generales y su publicación no constituye un aval. Toast no garantiza la precisión ni la integridad de la información, el texto, los gráficos, los enlaces y otros elementos que incluye este contenido. Toast no garantiza que alcanzarás ningún resultado específico si sigues los consejos que aparecen aquí. Te recomendamos consultar con un profesional, como un abogado, contador o asesor comercial, para recibir asesoramiento específico para tu situación.
 Tendencias


Subscribe to On the line
Sign up to get industry intel, advice, tools, and honest takes from real people tackling their restaurants' greatest challenges.
Al enviar, aceptas recibir correos electrónicos de marketing de Toast. Trataremos tu información de acuerdo con nuestra declaración de privacidad. Información adicional disponible para residentes de California aquí.