Average Restaurant Square Footage: A Comprehensive Guide for 2026
Learn how much space restaurants need in 2026, with benchmarks, layout tips, and cost considerations for every format.
Autor
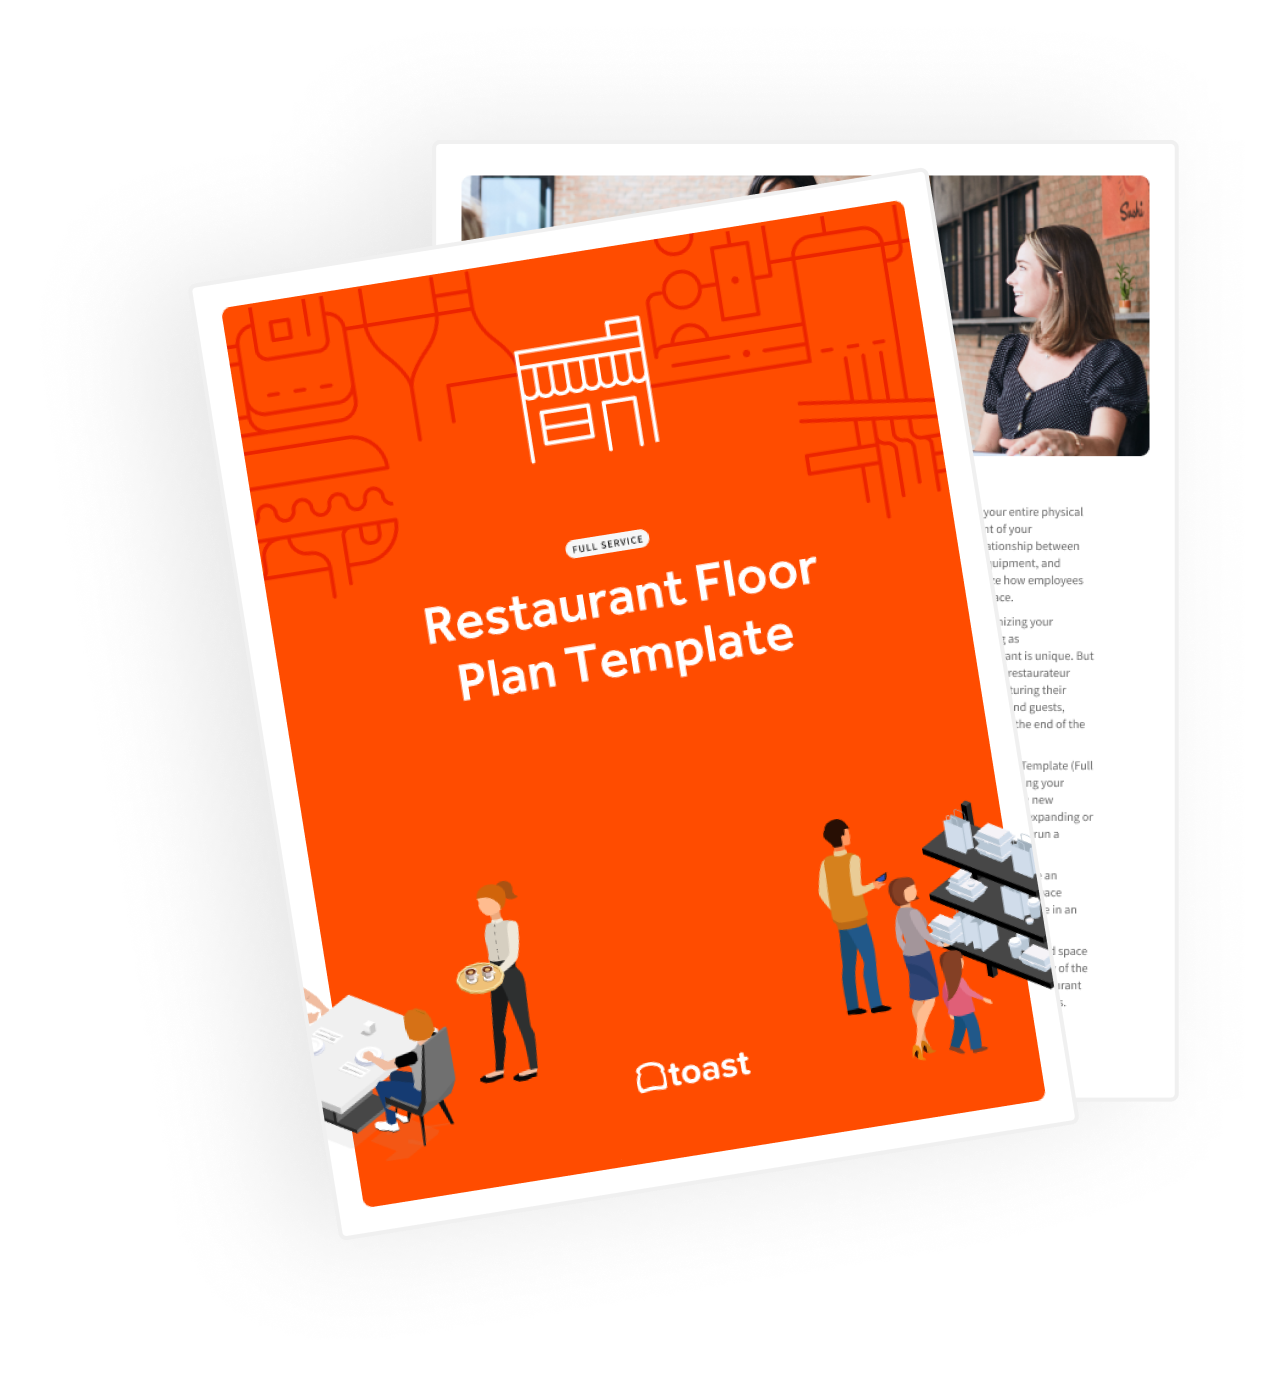
Plantillas de planos de planta de restaurantes
Usa estas plantillas de planos de planta de restaurantes para inspirarte o como un mapa para orientarte. También puedes reimaginar el diseño y la configuración de los espacios de tu restaurante.
Obtener descarga gratisUnderstanding average restaurant square footage has become increasingly critical in 2026 as operators navigate space optimization challenges, rising real estate costs, and evolving service models. This guide explores how square footage varies by restaurant type — from fast-casual formats traditionally sized between 1,600 and 1,800 square feet (about half the area of a tennis court) to larger full-service establishments that can span several thousand square feet. As restaurant concepts continue to evolve, particularly with QSRs adopting smaller footprints, more efficient kitchens, self-serve kiosks, and drive-through-only models, space planning has become a cornerstone of strategic success.
Plantillas de planos de planta de restaurantes
Usa estas plantillas de planos de planta de restaurantes para inspirarte o como un mapa para orientarte. También puedes reimaginar el diseño y la configuración de los espacios de tu restaurante.

Current restaurant size benchmarks by concept
Restaurant size varies dramatically based on concept and service style. Each format optimizes space allocation differently, depending on its business model and customer experience goals. Today’s operators are increasingly designing with intention, focusing on flexibility and performance rather than square footage alone. As Aleksandra Kaplan, partner at the restaurant-focused architecture firm Swan Dive Design Studio, put it: “A smaller footprint isn’t a limitation—it’s an invitation to get creative.”
Small footprint success stories
Smaller diners or high-end establishments can function effectively with 1,000 to 2,000 square feet of total space. With thoughtful planning, these compact formats can deliver strong performance without sacrificing guest experience.
Quick-service restaurants (QSRs)
QSRs typically maintain smaller footprints for operational efficiency. Today’s QSRs are increasingly embracing smaller, streamlined formats in response to rising real estate costs and evolving customer behavior.
For example, Taco Bell’s “Go Mobile” concept, launched in 2021, reduced the traditional footprint by nearly half, focusing on dual drive-thrus, mobile pickup shelves, and minimal dine-in space to meet modern customer expectations.
Casual dining
Casual dining concepts usually fall between QSRs and fine dining in terms of size. Most casual restaurants span 1,615 to 4,305 square feet, balancing table service with high turnover.
For example, Olive Garden locations typically fall within this size range and are designed to seat over 200 guests per location, accommodating both dine-in traffic and online orders with efficient back-of-house operations.
Fast casual
Fast-casual restaurants bridge the gap between quick-service and full-service formats. These operations typically occupy 1,076 to 3,767 square feet, allowing for a mix of speed, quality, and guest comfort.
For example, Shake Shack operates in this footprint range, prioritizing streamlined ordering and fast service while offering dine-in comfort and premium ingredients.
Fine dining
Fine dining restaurants generally require more space to support service standards and elevated guest expectations. These establishments typically range from 2,153 to 5,382 square feet, offering a luxurious and spacious dining experience.
For example, Eleven Madison Park in New York City seats just 80 guests, but spans a spacious layout to accommodate multi-hour tasting menus and premium service pacing.
The 60/40 rule for space allocation
Many restaurants follow a standard space allocation model that supports both guest experience and operational efficiency. The commonly used 60/40 rule designates:
60% of the total area for the dining room
40% for the kitchen and food prep areas
This ratio creates a balanced footprint between revenue-generating dining space and back-of-house functionality.
Adapting the rule by concept
While the 60/40 guideline is a useful starting point, not every restaurant follows it exactly. Total Food Service suggests this split is ideal for traditional full-service models, but operational needs can shift the balance.
Quick-service restaurants flip the ratio
QSRs often reverse the standard allocation. In these production-driven environments, only 45% of space may go to seating, while 55% is devoted to kitchen and storage. This supports faster throughput and high-efficiency operations.
Practical application of the 60/40 rule
For example, a restaurant with 5,000 square feet will have:
Dining area: 3,000 square feet
Kitchen and prep: 2,000 square feet
With 200 seats, the restaurant would provide roughly 15 square feet per seated guest. This kind of planning gives operators a reliable framework for estimating layout needs.
Space per guest calculations
How much space you allocate per customer can significantly impact both guest comfort and operational flow. It’s not just about seating — space calculations must also account for aisles, wait stations, cashier areas, and circulation zones.
General restaurant average
Most restaurants and coffee shops with a general menu allocate about 15 square feet per person. This is considered a well-balanced standard for casual, sit-down service.
Full service vs. fine dining
Different service levels demand different space needs:
Full-service restaurants: Average recommended space is 12 to 15 square feet per guest.
Fine dining restaurants: Require more space, 18 to 20 square feet per guest, to accommodate larger tables, wider aisles, and more attentive service.
Efficiency vs. luxury
Layout efficiency varies by format:
Banquet seating: As little as 10 square feet per person
Fine dining: Up to 20 square feet per person
Typical average for most operations: Around 15 square feet per person
These benchmarks help operators strike the right balance between seat capacity and guest experience.
Kitchen size guidelines and considerations
Commercial kitchen sizing has evolved beyond traditional square footage benchmarks toward more nuanced planning approaches. The average commercial kitchen is around 1,000 square feet — though today’s best practices often require less space, depending on the concept. Modern kitchen design increasingly focuses on efficiency and functionality rather than pure square footage metrics.
Tie kitchen size to front-of-house capacity
A more practical rule is to allocate 5 square feet of kitchen space for every seat in your front of house (FoH). For example, a restaurant serving 30 people at a time should allocate 150 square feet for the kitchen. This ensures the kitchen is scaled to service volume and avoids under- or over-building.
Menu and concept matter
Kitchen size requirements vary widely depending on the operation:
Sports bars: Typically require less kitchen space
Fine dining: Need more space to accommodate complex prep and plating
The complexity of food preparation and service style directly influences spatial requirements for back-of-house operations.
Ghost kitchens redefine the model
Ghost kitchens are a growing segment that breaks traditional rules:
Typically smaller at only 200 to 300 square feet
No dine-in space required
Focused solely on delivery efficiency
These micro-kitchens are optimized for speed, low overhead, and digital ordering platforms. Companies like Kitchen United operate delivery-only kitchens as small as 200 to 300 square feet, enabling multiple restaurant brands to run simultaneously from a single location.
Cost implications of restaurant size
Your restaurant’s square footage directly impacts both initial investment and ongoing operational costs.
Average cost per square foot
The cost to open a restaurant varies widely, typically ranging from $100 to $800 per square foot. Factors that influence this range include:
Location and local real estate market: Urban areas tend to have higher rent and construction costs than suburban or rural locations.
Restaurant concept (QSR vs. fine dining): Full-service and upscale concepts generally require more space, design, and infrastructure than quick-service models.
Whether you’re building from scratch or renovating an existing space: New construction often costs more up front, while renovations may save money but come with limitations and code compliance upgrades.
Make space decisions with ROI in mind
Understanding cost per square foot helps operators make informed decisions about space requirements. The square footage includes everything from:
Kitchen space
Dining
Bar space
The cost per square foot will be further affected by whether or not you are building from scratch or working with an already existing space.
Space-to-seating revenue balance
Revenue potential must be weighed against space costs when determining optimal restaurant size.In the industry, a rule of thumb is to accommodate 12 square feet of space for every customer you seat, before accounting for kitchen and workspace. This guideline helps operators balance capacity with operational efficiency.
Location drives profitability
Location significantly impacts the cost-effectiveness of different space sizes. Market conditions, rent costs, and customer density all influence the optimal square footage for profitability. Operators must carefully analyze their specific market conditions when determining appropriate restaurant size.
Evolving trends in restaurant space design
The restaurant industry has witnessed significant shifts in space utilization patterns since 2020. These changes reflect evolving consumer preferences, operational efficiencies, and cost management strategies.
Technology is reshaping layout needs
Technology adoption has enabled more efficient space utilization across restaurant formats. Automated systems, improved kitchen equipment, and digital ordering platforms allow operators to serve more customers within smaller footprints while maintaining service quality.
Quick-service (QSR) restaurants embrace smaller footprints
Quick-service restaurants (QSRs) are leading the charge with:
Smaller square footage: Lower buildout and rent costs while maintaining high throughput
Streamlined kitchens: Designed for speed, simplicity, and delivery efficiency
Self-serve kiosks: Reduce front-of-house labor and speed up ordering
Drive-through-only models: Eliminate dine-in space entirely for faster, off-premise service
These concepts prioritize speed, efficiency, and low overhead while catering to evolving guest preferences. For example, McDonald’s “CosMc’s” concept, launched in 2023, operates with a drastically reduced footprint compared to traditional McDonald's locations, focusing solely on beverages and drive-thru efficiency.
Fast-casual continues to lead in efficient design
Fast-casual restaurants remain a standout for space optimization:
Average footprint: 1,600 to 1,800 square feet
High-volume efficiency: Sales success without the need for excess space
Balanced service design: Layouts that support both dine-in and off-premise flow
These compact formats show how thoughtful space design can support both profitability and customer satisfaction. For example, Chipotle locations typically operate within this range and generate some of the highest average unit volumes in the fast-casual category — often exceeding $2.5 million annually — while maintaining streamlined layouts built for throughput.
Revenue per square foot considerations
Sales per square foot is one of the most important metrics for evaluating a restaurant’s space efficiency and overall performance. For profitability, operators should aim for these benchmarks:
Full-service restaurants: At least $150 per square foot
Limited-service restaurants: No less than $200 per square foot, depending on the concept and menu
These figures help assess whether a restaurant’s footprint is being used effectively.
High-performing concepts raise the bar
Top fast-casual franchises average around $505 per square foot, showcasing the revenue potential of efficient layouts and strong operational execution.
Watch for red flags
Falling below benchmark thresholds can be a red flag:
Low full-service revenue: Below $150 per square foot often means unprofitability
Limited-service losses: Earnings under $200 per square foot signal financial risk
Understanding and applying these revenue targets can help operators fine-tune their space usage and ensure long-term sustainability.
Wait station and service area planning
Effective space planning extends beyond dining and kitchen areas to include essential service zones that support smooth operations.
Wait station sizing
How much space you dedicate depends on the number of diners served:
Small station: 6 to 10 square feet, serves approximately 20 diners
Large central station: 25 to 40 square feet, serves approximately 60 diners
Proper wait station sizing ensures efficient service delivery without compromising valuable dining space.
Bar area considerations
Bar layout should reflect the service model:
Standing room only: Allow 1′8″ to 1′10″ per person
Bar seating: Space 2 feet between stools for comfort
These dimensions help maintain a balance between capacity and guest experience.
Overall service area allocation
A general guideline for total space distribution:
60%: dining area, bar, restrooms, and waiting areas
40%: kitchen, storage, and food prep spaces
This ratio supports both operational efficiency and a comfortable, well-functioning guest environment.
Modern space optimization strategies
Contemporary restaurant design increasingly emphasizes flexibility and multi-functional spaces. Operators are implementing strategies that allow spaces to serve multiple purposes throughout different service periods, maximizing revenue potential from every square foot.
Technology integration
Smart tech is streamlining operations and shrinking space requirements:
Digital menu boards: Reduce physical signage and allow real-time updates
Mobile ordering systems: Minimize wait times and support off-premise sales
Automated service elements: Improve speed and reduce front-of-house labor
These tools reduce the need for physical space while increasing efficiency and customer throughput.
Outdoor dining expansion
Patio and outdoor seating have become vital to the layout strategy. Many operators are investing in these spaces to:
Extend effective dining capacity: Add usable square footage without expanding the building
Appeal to guests who prefer outdoor options: Meet growing demand for fresh-air dining
Offset interior space limitations: Create more seating while maintaining distancing and comfort
This trend continues to grow, especially as consumer preferences lean toward more open-air dining environments. For example, Sweetgreen has expanded its patio offerings in urban areas like Los Angeles and Austin to accommodate rising demand for outdoor dining without increasing indoor square footage.
Regional and market variations
Restaurant size requirements vary significantly based on geographic location and market characteristics.
Urban vs. suburban space demands
Restaurant size often depends on geographic setting and market density:
Urban markets: Tend to favor smaller, more efficient formats due to higher real estate costs and limited space
Suburban and rural areas: Often support larger restaurant footprints with more generous space allocations
Climate and seasonality
Climate impacts how much reliance a restaurant can place on outdoor seating:
Temperate climates: May lean on patios and open-air extensions
Extreme climates: Require restaurants to prioritize indoor capacity for year-round service
Building codes and zoning
Local regulations can limit or shape how a space is designed. Understanding the following early in the planning process helps operators avoid costly revisions and ensure compliance with local guidelines:
Zoning laws: Determine how a property can be used based on local land-use regulations
Health codes: Govern food safety, sanitation, and kitchen layout requirements
Permit restrictions: Impact construction, remodeling, and occupancy approvals
Future outlook for restaurant sizing
The restaurant industry continues evolving toward more efficient space utilization models driven by cost pressures and changing consumer preferences. Operators are increasingly focused on maximizing revenue per square foot rather than simply expanding total space.
Hybrid concepts on the rise
Operators are embracing multi-purpose spaces that blend:
Restaurant service: Core food and beverage offerings for dine-in and takeout
Retail: Branded merchandise, pantry items, or packaged goods
Catering: Off-site event services that generate additional revenue streams
Entertainment: Events, performances, or experiences that drive foot traffic and extend dwell time
These hybrid models boost space utilization and open new revenue streams within a single location. For example, Eataly combines retail, restaurant, and event space under one roof — creating a multi-revenue stream model that maximizes every square foot.
Delivery and takeout integration
The rise of off-premise dining — meals ordered for pickup, delivery, or drive-thru — continues to shape floor plans. Restaurants are optimizing for both:
Dine-in experience: Comfortable seating, ambiance, and flow for on-premise guests
Takeout and delivery flow: Dedicated pickup areas and streamlined kitchen operations for off-site orders
This dual-purpose design requires intentional space allocation to support each service model without sacrificing efficiency.
Frequently asked questions
What is the average size of a restaurant?
Restaurant sizes vary significantly by concept. Fast-casual restaurants are typically between 1,600 and 1,800 square feet, while fine dining restaurants usually occupy 2,153 to 5,382 square feet.
How much space should be allocated to dining versus kitchen areas?
The standard ratio for dining room to kitchen space is 60 to 40, with the smaller portion reserved for the kitchen, though quick-service restaurants typically flip that ratio.
How much space per customer should restaurants plan for?
Most restaurants average about 15 square feet per person, though fine dining requires 18 to 20 square feet per person, and banquet seating may require as little as 10 square feet per person.
What kitchen size is needed for a restaurant?
Allocate at least five square feet for every seat in your front of house, though the average commercial kitchen is around 1,000 square feet. Kitchen size should match operational complexity and service volume.
What revenue per square foot should restaurants target?
Full-service restaurants should average at least $150 per square foot, while limited-service restaurants should average no less than $200 to maintain profitability.
Final thoughts
Understanding average restaurant square footage requirements enables operators to make informed decisions about space planning, cost management, and revenue optimization. As the industry continues evolving toward greater efficiency and flexibility, successful restaurants will be those that maximize the potential of every square foot while delivering exceptional customer experiences. In 2026 and beyond, adaptability and strategic design will remain key to staying competitive in a shifting real estate and consumer landscape.
¿Es útil este artículo?
AVISO LEGAL: Esta información se proporciona solo con fines informativos generales y su publicación no constituye un aval. Toast no garantiza la precisión ni la integridad de la información, el texto, los gráficos, los enlaces y otros elementos que incluye este contenido. Toast no garantiza que alcanzarás ningún resultado específico si sigues los consejos que aparecen aquí. Te recomendamos consultar con un profesional, como un abogado, contador o asesor comercial, para recibir asesoramiento específico para tu situación.


Subscribe to On the line
Sign up to get industry intel, advice, tools, and honest takes from real people tackling their restaurants' greatest challenges.
Al enviar, aceptas recibir correos electrónicos de marketing de Toast. Trataremos tu información de acuerdo con nuestra declaración de privacidad. Información adicional disponible para residentes de California aquí.