![[US] How Americans are Changing Their Coffee Drinking Habits](http://images.ctfassets.net/rric2f17v78a/7qb4sgKPxIlb39bQvvJR1f/adb12295189da0ef262ee1a0f682c525/Q42025_Restaurant-Trends-Report-Hero.jpg)
BOSTON, MA —Toast (NYSE: TOST) released its latest Restaurant Trends Report, providing insight into the state of the U.S. restaurant industry through an analysis of aggregated data from selected cohorts of restaurants and in select U.S. states on the Toast platform, which serves approximately 164,000 locations as of December 31, 2025.
Key Takeaways
*Note: Tipping is not limited to drink transactions.
Coffee has been a hot topic in the last few years — but more recently it isn’t a new viral coffee drink that has been grabbing attention. It’s been the price increase that has been turning heads.
There are a few reasons why your favorite brew has been pricier recently, whether in the grocery store aisle or at the cafe counter. These factors, which include climate, demand, input costs, and overhead, have affected everyone’s wallets. But have our buying habits changed at all?
To find out, Toast analyzed same-store sales across a cohort of restaurants on the platform between January 2024 and December 2025 to determine which types of coffee drinks guests are ordering and how their habits may have changed compared to 2024. It turns out that some upstarts may be overtaking classic American staples like the ever-reliable cup of drip coffee. All restaurant types were included in the analysis.
Drink categories seeing a pullback
Coffee & tea staples1
Green tea: Experienced the sharpest drop at -4.9%.
Black tea: Declined by -3.4%.
Regular hot drip coffee: A primary staple that saw a -3.3% decrease.
Cold brew: The popular chilled favorite fell by -2.2%
Other beverage category declines
Regular soda: Sales decreased by -2.3%.
Cappuccinos: Saw a more moderate dip of -0.4%.
Frappés: Remained nearly flat but trended downward at -0.6%.
Let’s start with the losers: regular hot drip coffee (-3.3%) and our beloved cold brew (-2.2%) both saw lower sales in 2025 than in 2024. Some staples fared even worse, with black tea down -3.4% and green tea down -4.9%, while regular soda (-2.3%), frappés (-0.6%), and cappuccinos (-0.4%) decreased a bit more moderately.
So if these old reliables are down, what's taking their place?
Drink categories experiencing growth
Caffeine in a can
Energy drinks: Saw the largest surge with an 8.7% increase as consumers shifted toward convenient, ready-to-drink options.
Herbal teas: Experienced significant growth of 8.6%.
Diet sodas: Increased by 7.4% compared to 2024.
Handcrafted and barista-made coffee
Lattes: Increased by 4.0%.
Espresso shots: Increased by 3.3%.
Americanos: Increased by 1.4%.
Macchiatos: Increased by 0.6%.
Subscribe to Data by Toast
Use Toast’s data insights to get ahead of the curve and track market trends on menu pricing, industry patterns, and more.
Al enviar, aceptas recibir correos electrónicos de marketing de Toast. Trataremos tu información de acuerdo con nuestra declaración de privacidad. Información adicional disponible para residentes de California aquí.
It turns out that instead of mugs, Americans were reaching for cans for their caffeine boost. Energy drinks grew a whopping 8.7%, while diet sodas increased 7.4% in 2025 compared to 2024. Herbal teas also experienced a big bump at 8.6%, suggesting some are looking for a caffeine-free fix.
But some coffee categories did grow, specifically those handcrafted by a barista — drinks that many people don’t have the skills or time to make at home.
Espresso drinks, including lattes (+4.0%), espresso shots (+3.3%), Americanos (+1.4%), and macchiatos (+0.6%), all increased sales in 2025. As mentioned earlier, frappés (-0.6%) and cappuccinos (-0.4%) decreased ever so slightly.
What this could signal:
Americans are willing to pay for these handcrafted drinks. They may be pulling back on orders that they can easily make at home or buy at the grocery store, like a regular drip coffee or a cold brew. It could also signal that while people may be drinking coffee at home, others value curling up in a cozy cafe with a specialty-crafted drink.
While at-home espresso machines are increasingly popular, the barrier to entry is high, and that luxury may be reserved for those in larger income brackets with more counter space. Pulling shots of espresso and steaming milk at home requires a little more skill than drip coffee, which could be one reason those drinks are overperforming while others are not.
It could also be that the rise in prices means Americans visiting coffee shops are springing for the treats. Maybe you aren’t a daily latte drinker, but if you find yourself in a cafe, you may be more inclined to treat yourself to something nice – especially if you may be cutting back elsewhere. It could also signal that people with higher disposable income aren’t slowing their spending, and buyers have less price sensitivity when it comes to their daily coffee run.
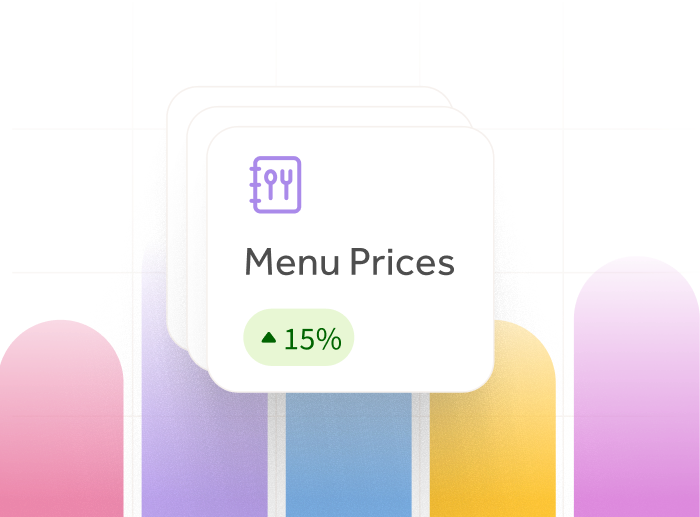
How expensive is coffee at restaurants?
Toast tracks the median prices of regular drip coffee and cold brew in its Menu Price Monitor each month. (Note: The Menu Price Monitor does not provide insights into same-store sales. Data is compiled from a snapshot of all applicable Toast platform restaurant locations in a month.)
In February 2026, the median price of a cup of regular drip coffee at restaurants on the Toast platform was $3.65, up 4.3% from February 2025. In January 2024, the price of a cup of coffee was $3.25.3
In February 2026, the median price of a cold brew coffee at restaurants on the Toast platform was $5.58, up 4.1% from February 2025. In January 2024, the price of cold brew was $5.17.
Why is coffee more expensive now?
For a little background on how we got here, there are a few reasons why coffee prices have risen in the last few years.
Growing requirements: Coffee requires very specific conditions to grow and is primarily sourced from an area known as the “bean belt,” which lies between the Tropic of Cancer and the Tropic of Capricorn.
Weather changes: Extreme weather, including both droughts and flooding, has put a strain on coffee production over the past few years, but demand in the U.S. and elsewhere has continued to grow.
Trade policies: Several trade policies have affected coffee import costs.
What has changed in recent months
Tariffs and supply chain: Global coffee commodity prices plunged in late November following the removal of tariffs on imports from Brazil, which could help ease costs for operators in the coming months. However, fluctuations in shipping costs can also raise prices.
Rainfall: Increased rainfall in Brazil has improved conditions and, therefore, also production outlooks.
Production estimates: Companhia Nacional de Abastecimento (CONAB), a forecasting agency in Brazil, predicts a 17.1% increase in processed bags of coffee beans in 2026.
Tipping remains flat at both quick and full-service restaurants
After a pullback in full-service restaurant tips in Q2 2025, the average has leveled out at 19.2%. Quick-service restaurant tips also remained flat at 15.8%.2
The average tip at full-service restaurants (FSRs) was 19.2% in Q4 2025, the same as in Q3 2025.
Quick-service restaurant (QSR) tips also remained flat at 15.8% in Q4 2025.
Tipping in each U.S. state
For another consecutive quarter, Delaware remained the best state overall for tipping, with a total average tipping percentage of 21.8% in Q4 2025, up from 21.1% in Q3 2025.
California is again at the bottom of the list for overall tips in Q4 2025, averaging 17.2%, the same as in Q3 2025.
AVISO LEGAL: Esta información se proporciona solo con fines informativos generales y su publicación no constituye un aval. Toast no garantiza la precisión ni la integridad de la información, el texto, los gráficos, los enlaces y otros elementos que incluye este contenido. Toast no garantiza que alcanzarás ningún resultado específico si sigues los consejos que aparecen aquí. Te recomendamos consultar con un profesional, como un abogado, contador o asesor comercial, para recibir asesoramiento específico para tu situación.