60 Restaurant Industry Statistics and Trends for 2026
This list covers the restaurant industry trends and management statistics every operator should know going into 2026.

ผู้เขียน
 RESOURCE
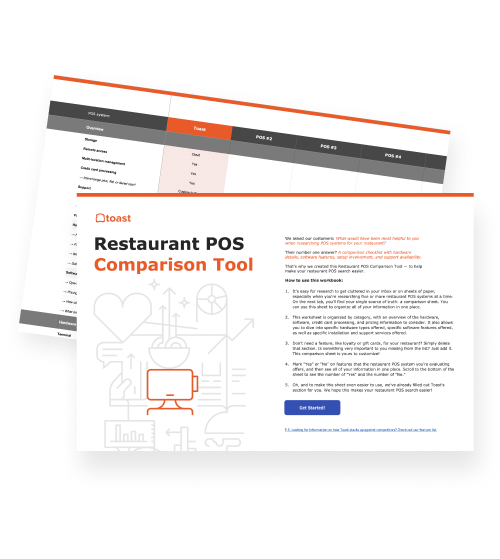
 Restaurant POS Comparison Tool
A free, customizable Restaurant POS Comparison Tool to research and compare point of sale systems in one Excel spreadsheet.
ดาวน์โหลดฟรีRestaurant industry trends in 2026 highlight four shifts: AI adoption, guest loyalty, discovery, and tipping holding steady despite economic pressure. Toast data puts numbers behind each:
In Q1 2026, 47% of AI queries restaurant operators made were about sales and revenue (according to Toast IQ data)
Up to 50% of restaurant volume can come from just 7% of guests (according to Toast platform data)
Rural diners rely on personal recommendations at a rate of 42% (according to Toast survey data)
The average restaurant tip at Toast restaurants in the U.S. was 19.3% at full-service restaurants in Q1 2026 (according to Toast platform data)
This article breaks down 60 statistics across these categories and more, so operators can see not just what's happening in the restaurant industry in 2026, but where it's moving fastest.
Restaurant industry economic trends
1. Restaurant sales are projected to reach $1.55 trillion
Restaurant and foodservice sales are projected to reach $1.55 trillion in 2026, with real, inflation-adjusted sales growth of 1.3%. The industry is growing, but the gains are still modest after inflation.
2. Growth is coming with margin pressure
The National Restaurant Association says operators are dealing with persistent cost pressures, uneven traffic, and rising costs in 2026. That means higher industry sales do not automatically translate into healthier restaurant profits.
3. Food costs are still elevated
Food costs are up 34% compared with pre-pandemic levels, according to the National Restaurant Association. That keeps pressure on purchasing, menu pricing, recipe costing, and portion strategy.
4. Restaurant menu prices are still rising
Food away from home prices rose 3.9% year over year in February 2026. Full-service meals rose 4.6%, while limited-service meals rose 3.2%.
5. Price pressure is expected to continue
USDA ERS forecasts food-away-from-home prices to rise 3.6% in 2026, faster than the 20-year historical average of 3.5%. Operators should expect pricing pressure to remain part of the planning environment.
6. Menu item inflation varies by category
Toast’s May 2026 Menu Price Monitor found regular coffee up 6.9%, cold brew up 3.7%, beer up 2.5%, burgers up 2.4%, burritos up 1.6%, and wings up 1.1% year over year. The takeaway: inflation does not hit every menu category evenly.
7. Menu price hikes have a ceiling
The James Beard Foundation’s 2026 Independent Restaurant Industry Report found that restaurants raising menu prices by more than 10% were most likely to expect lower profits. Operators need value, traffic, and cost control, not just higher prices.
8. Beef costs remain a menu pressure point
USDA ERS lowered its 2026 beef production forecast to 25.438 billion pounds and raised its 2026 slaughter steer price outlook to $250.16 per hundredweight. Restaurants with burger, steak, and beef-heavy menus should keep watching beef costs closely.
Restaurant labor and staffing trends
9. Quick-service wages are rising
Toast found that hourly wages across quick-service restaurants rose almost 11%, from $13 per hour in April 2022 to $14.42 per hour in April 2024.
10. Turnover is still high
Toast reports that the restaurant industry turnover rate was on track for 73.9% in 2024, its lowest annual rate since 2017 but still above pre-pandemic levels.
11. Many workers may leave the industry
Toast found that 30% of restaurant workers were at risk of leaving the industry within two years, which keeps retention near the center of staffing strategy.
12. Flexible scheduling helps attract staff
Toast found that 56% of restaurant employees accepted their most recent job because of the flexible schedule. It also found that 36% said scheduling was a factor that caused them to leave one restaurant job for another.
13. Bad managers drive churn
Toast found that 45% of team members looking to leave for another restaurant job cited dealing with a bad manager as a reason.
14. Full-service employment is still recovering
The National Restaurant Association reported that full-service restaurant employment was still 174,000 jobs, or 3.3%, below its pre-pandemic level as of May 2026.
15. Understaffing still limits growth
The National Restaurant Association found that nearly 8 in 10 short-staffed operators said understaffing significantly limits their ability to grow and succeed.
16. Foodservice will keep needing workers
BLS projects about 2.6 million openings each year in food preparation and serving occupations from 2024 to 2034.
Restaurant technology trends
17. Operators are getting comfortable with AI
Toast’s 2025 AI in Restaurants Survey found that 86% of operators are comfortable using AI, 81% plan to use more AI, and 81% believe AI will help them be more efficient.
18. AI is moving into connected restaurant systems
Toast reported that Toast IQ is connected to each restaurant’s sales, labor, menu, guest, and operational data. In Q1 2026, Toast analyzed anonymized Toast IQ inputs from more than 125,000 U.S. restaurant locations using Toast IQ Assistant.
19. AI is supporting labor decisions
Toast found that 13% of restaurants using Toast IQ asked about labor costs and efficiencies in Q1 2026.
20. Drive-thru technology is becoming more integrated
There are just over 140,000 drive-thru locations across the U.S. restaurant industry according to 2026 Technomic Ignite data.
21. Handheld POS is supporting faster service
Toast reports that its handhelds have powered more than 2 billion orders over the last seven years. Toast also says customers have seen table turn times improve by 15-20% with handheld POS systems.
22. Back-office tech is a major investment area
The National Restaurant Association reported that 52% of operators planned to invest in back-office technologies, 52% in inventory control and management, and 48% in POS systems.
23. POS systems are becoming a higher priority
Nation’s Restaurant News reported that 53% of operators prioritized POS systems in 2026, up from 40% the year before.
Restaurant delivery and off-premise trends
24. Delivery and takeout remain frequent habits
Toast found that 40% of respondents use food delivery apps or order takeout three to five times per month, and 47% are willing to pay $3-$6 in delivery fees.
25. Online ordering can save restaurant teams time
Toast reports that 78% of customers using Online Ordering as part of Digital Storefront Essentials strongly agree that it’s helped save them time.
26. Curbside is part of the off-premise mix
Curbside pickup can support several handoff models, including phone orders, online orders, app orders, walk-up pickup, and drive-thru-style pickup.
27. Packaging can shape off-premise demand
The National Restaurant Association reported that 90% of off-premise customers would likely order a greater variety of takeout or delivery items if packaging helped preserve temperature, taste, and quality.
28. Off-premise now drives most restaurant traffic
The National Restaurant Association reported that nearly 75% of restaurant traffic now happens off-premises, including takeout, delivery, and drive-thru orders.
29. Off-premise demand still has room to grow
The National Restaurant Association says most consumers would order off-premises more often if they had more money to spend, pointing to pent-up demand for takeout, delivery, and drive-thru.
30. Younger consumers depend on takeout and drive-thru
The National Restaurant Association reported that 51% of Gen Z and millennial consumers say picking up takeout or ordering drive-thru meals is essential to their lifestyle, while 41% rely heavily on delivery.
Restaurant consumer behavior trends
31. Regulars drive outsized order volume
Toast and Resy’s Regulars Report found that up to 50% of restaurant order volume can come from just 7% of guests.
32. Guests are choosing familiar favorites
Toast found that 48% of diners visit a favorite restaurant when going out, rather than trying somewhere new.
33. Recognition matters more than points
Toast found that 48% of diners say being remembered by name or usual order makes them feel most valued. That is more than double the 22% who prioritize loyalty points.
34. Personalization still has a gap
Toast surveyed 1,466 U.S. adults who had dined in, ordered takeout, or ordered delivery in the last three months. Only 20% said they consistently receive personalized restaurant experiences.
35. Regulars tip more
Toast and Resy found that 77% of respondents tip more at restaurants where they are regulars. Among those guests, 37% add an extra 10-15% or more on top of their standard gratuity.
36. Diners are still prioritizing restaurants
The National Restaurant Association found that 56% of consumers dined at a restaurant in the past week, making restaurants the top discretionary spending category.
37. Guests are spending more carefully
The National Restaurant Association reported that 36% of consumers spent less at restaurants than the previous quarter, with younger consumers leading the pullback.
38. Value now means more than discounts
McKinsey found that among consumers who said dining out “wasn’t worth the money,” food quality and portion size were the top sources of disappointment.
Restaurant marketing and social media trends
39. Retention is becoming a marketing priority
Toast data found that just 7% of a restaurant’s guest base can drive up to 50% of total order volume, making repeat guests a major growth lever.
40. Local discovery depends on the market
Toast found that 50% of diners say social media played a role in discovering a restaurant. That rises to 56% among urban diners and falls to 42% among rural diners.
41. Email marketing is getting more data-driven
Toast Email Marketing connects with Toast POS and Toast Online Ordering so restaurants can send targeted promotions using guest and ordering data.
42. Marketing suites are tying campaigns to sales
Toast customers using its full Marketing Suite, including Email Marketing, saw 63% more sales than those without it.
43. Younger diners are using social media for discovery
Business Insider reported that 73% of Gen Z and millennial respondents in a 2025 survey said a social media review led them to visit a restaurant in the past three months. Nearly 44% said they use social media as their primary restaurant discovery tool.
44. Reviews are becoming a stronger conversion signal
BrightLocal’s 2026 Local Consumer Review Survey found that 85% of consumers are more likely to use a business after reading positive reviews, while 77% are deterred by negative reviews.
45. Review freshness matters more
PinMeTo’s coverage of BrightLocal’s 2026 survey reported that 74% of consumers look for reviews written in the last three months, and 32% want reviews from the last two weeks.
Restaurant menu and food trends
46. Burgers still need to prove their value
Toast reported that the median burger price reached $14.73 in May 2026, up 2.4% year over year.
47. Burritos are becoming higher-cost builds
Toast reported that the median burrito price reached $13.59 in May 2026, up 1.6% year over year.
48. Wings remain a reliable bar food
Toast reported that the median wing order price reached $13.92 in May 2026, up 1.1% year over year.
49. Cold brew keeps its premium position
Toast reported that the median cold brew price reached $5.60 in May 2026, up 3.7% year over year and 50% higher than regular coffee.
50. Premium coffee is outperforming basic coffee
Toast found that lattes rose 4.0%, espresso shots rose 3.3%, and Americanos rose 1.4% in 2025. Regular hot drip coffee fell 3.3%, and cold brew fell 2.2%.
51. Comfort food is getting more global
The National Restaurant Association’s 2026 culinary forecast highlighted smashed burgers, Caribbean curry bowls, elevated instant noodles, global comfort foods, and value menus among major trends.
52. Smaller portions are becoming strategic
Technomic predicts that smaller portions, snacks, and shareables will become more common in 2026, along with craveable foods that add protein, fiber, and functionality.
53. Fermentation is becoming intentional
James Beard Foundation chefs pointed to fruit vinegars, cultured chili pastes, and preservation-driven pantry items as ways to build flavor, reduce waste, and express seasonality.
54. International snacks are influencing menu ideas
Whole Foods Market named international snacking a top 2025 food trend, citing chamoy candy, mango sticky rice chips, chili crunch mixes, plantain snacks, and other globally inspired formats.
Restaurant payment and transaction trends
55. Full-service tips remain near 19%
Toast found that the average tip at U.S. full-service restaurants was 19.3% in Q1 2026, while the overall average tip across restaurant types was 18.8%.
56. Payment processing is becoming more integrated
Toast Payments supports credit cards, debit cards, contactless payments, Toast gift cards, cash, prepaid cards, EBT SNAP, EBT Cash, and split payments across multiple payment types.
57. Guests want faster ways to order and pay
The Restaurant Technology Landscape Report found that options that make it easier and faster to order and pay topped customers’ favorite restaurant technologies.
58. Contactless and mobile payments are expected
The National Restaurant Association reported that 79% of consumers prefer contactless or mobile payments, and 73% prefer digital wallets such as Apple Pay, Samsung Pay, Google Wallet, PayPal, or Venmo.
59. Swipe fees remain a margin pressure
The National Restaurant Association reported that 66% of operators said their credit or debit card processing fees increased in the past two years, with an average increase of 9.4%.
60. Card processing is a top operating expense
The National Restaurant Association says credit card transaction processing is the third-largest operating expense for most restaurants, behind food and labor.
What operators are watching most closely in 2026
Restaurant operators are watching the numbers behind every shift more closely this year. Sales are still growing, but costs, traffic, and guest spending are not moving evenly.
The biggest pressure points are food costs, labor, staffing, swipe fees, menu prices, and value perception. Operators are also paying close attention to off-premise demand, repeat guests, AI tools, POS data, and which menu items are actually helping margins.
The common thread is control. Restaurants can’t control every cost or consumer trend, but they can use better data to make faster decisions about pricing, staffing, purchasing, marketing, and the guest experience.
How Toast POS provides more restaurant industry trends and data
Most restaurant industry data tells you what happened. Toast tells you how you stack up and what to do next.
With Toast Benchmarking pulling anonymized data from over 171,000* restaurants, you're not comparing yourself to a survey average. You're measuring your turn times, your guest counts, your sales by hour against operators like you, in your market, in real time.
And when the data surfaces something worth acting on, Toast IQ is there to help you move. Not to overhaul how you work, but to handle the little tasks cluttering your to-do list so your attention stays where it counts. Timely insights, less guessing, more running your business.
Together, Benchmarking and Toast IQ give operators two things most industry reports don't: a real-time comparison to their actual market, and a tool that turns that comparison into a next step.
*As of Q1 2026.
FAQs (add 2 more FAQs)
What is the average tip at full service restaurants?
The average restaurant tip at Toast restaurants in the U.S. was 19.3% at full-service restaurants in Q1 2026 (according to Toast platform data).
Where can I find the latest restaurant data and trends?
Data by Toast serves up data and insights from over 171,000* restaurants, and is a top source for the latest industry trends.
What exactly is Toast IQ Grow, and how does it help my business?
Toast IQ Grow is a growth and lifecycle engine that takes the burden of growth off your plate by unifying AI powered by Toast IQ with expert Marketing Success Manager support to help drive traffic, increase retention, and maximize first-party revenue. Instead of managing multiple logins or expensive agencies, you get a single platform that helps find new customers and turn them into regulars.
What are the biggest restaurant industry trends in 2026?
The biggest restaurant industry trends in 2026 include tighter margins, rising food and labor costs, more AI and POS investment, stronger off-premise demand, value-focused guests, and more data-driven marketing.
How can restaurants use data to make better decisions?
Restaurants can use data to track sales, labor, menu performance, guest behavior, tips, ordering channels, and repeat visits, then use those insights to adjust pricing, staffing, promotions, and operations faster.


บทความนี้มีประโยชน์สำหรับคุณหรือไม่
ข้อความปฏิเสธความรับผิดชอบ ข้อมูลนี้จัดทำขึ้นเพื่อวัตถุประสงค์ในการให้ข้อมูลทั่วไปเท่านั้น และการเผยแพร่ข้อมูลนี้ไม่ถือเป็นการรับรองใดๆ Toast ไม่รับประกันความถูกต้องหรือความสมบูรณ์ของข้อมูล ข้อความ กราฟิก ลิงก์ หรือรายการอื่นใดที่รวมอยู่ในเนื้อหานี้ Toast ไม่รับประกันว่าคุณจะได้รับผลลัพธ์ที่เฉพาะเจาะจงใดๆ หากคุณปฏิบัติตามคำแนะนำในเอกสารนี้ คุณอาจต้องปรึกษาผู้เชี่ยวชาญ เช่น ทนายความ นักบัญชี หรือที่ปรึกษาทางธุรกิจ เพื่อขอคำแนะนำที่เหมาะสมกับสถานการณ์ของคุณโดยเฉพาะ
 กำลังมาแรง

Subscribe to On the line
Sign up to get industry intel, advice, tools, and honest takes from real people tackling their restaurants' greatest challenges.
เมื่อส่งข้อมูล แสดงว่าคุณตกลงที่จะรับอีเมลการตลาดจาก Toast เราจะจัดการข้อมูลของคุณตาม คำชี้แจงความเป็นส่วนตัว ดูข้อมูลเพิ่มเติมสำหรับผู้อยู่อาศัยในรัฐแคลิฟอร์เนียได้ที่ คลิกที่นี่