Forecasting for Restaurants: Predict Demand and Costs
Learn how restaurant forecasting works and how to use sales, labor, and inventory data to plan ahead with confidence.

ผู้เขียน
 RESOURCE
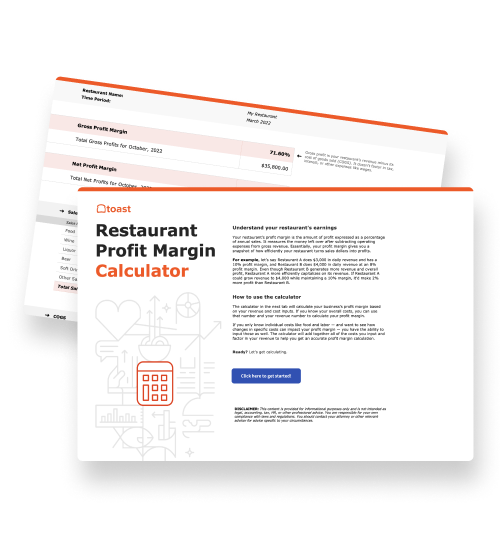
 Restaurant Profit Margin Calculator
Use this free Restaurant Profit Margin Calculator to see how efficiently you turn sales dollars into profits.
ดาวน์โหลดฟรีRestaurant forecasting helps operators estimate how busy their restaurant will be and what they’ll need to meet that demand. A reliable forecast can guide purchasing, food prep, staffing, and cash-flow decisions before changing conditions affect service or profitability.
Doing that well requires more than historical sales alone. Restaurants need to connect sales with labor, menu, guest, inventory, and operational data, then turn that information into decisions.
Toast IQ shows how that connected approach can work. Because it draws from data across the Toast platform, operators can ask questions in conversational language and receive insights grounded in their own business without searching through separate reports.
Whether those insights come from AI or a more traditional forecasting process, their value depends on how effectively operators turn them into purchasing, staffing, and financial plans.
This guide covers the main types of restaurant forecasting, the data behind them, and a practical process for building more accurate sales, inventory, labor, and cost forecasts.
Key takeaways
Restaurant forecasting uses historical and current operational data to predict sales, guest demand, inventory requirements, labor needs, and costs.
Sales, inventory, labor, and cost forecasts work best when combined into one connected operating plan.
Accurate forecasts can help restaurants reduce food waste, prevent shortages, control labor costs, and protect the guest experience.
Restaurants can improve forecast accuracy by adjusting historical baselines for reservations, weather, events, promotions, and changing costs.
Connected restaurant data makes it easier to identify trends, turn forecasts into decisions, and compare projections with actual results.
Restaurant Profit and Loss Statement Template
Evaluate your restaurant's financial strengths and weaknesses with the free P&L and income statement template.

What is restaurant forecasting?
Restaurant forecasting is the process of predicting sales, demand, inventory, labor, and costs using historical performance and current operating conditions. Restaurants use these forecasts to decide what to purchase, how much food to prepare, how many employees to schedule, and how much cash they will need.
A forecast estimates what is likely to happen, while a budget establishes what the restaurant plans or wants to happen. Forecasts should be updated as sales, reservations, costs, weather, and other conditions change. A basic restaurant sales forecast can begin with this formula:
Forecasted sales = Expected guest count × Expected average check
For example, a restaurant expecting 200 guests at an average check of $32 would forecast $6,400 in sales. The operator could then use that projection to estimate inventory, labor, and cash requirements.
Why is restaurant forecasting important?
Restaurant forecasting connects expected demand with the people, ingredients, and capital required to serve it. This allows operators to prepare before changes in traffic, sales, or costs affect the guest experience and bottom line.
Reduce food waste: Purchasing and preparing food based on expected demand can limit overproduction and spoilage.
Prevent shortages: Item-level forecasts help restaurants keep popular dishes available without carrying unnecessary inventory.
Control labor costs: Sales and guest forecasts help managers schedule sufficient coverage without paying for excess hours.
Improve service: Better preparation can reduce wait times, protect menu availability, and help teams manage rushes.
Protect margins: Forecasting revenue and expenses together shows how changing food and labor costs may affect profit.
Plan for growth: Longer-term forecasts support decisions about pricing, hiring, equipment, marketing, and expansion.
A peer-reviewed study in the Journal of Cleaner Production tested machine-learning forecasts using three to nine years of daily data from three foodservice operations. The models could have reduced wasted meals by 14% to 52% and unmet demand by 3% to 16% compared with the operations’ baseline forecasting methods.
Restaurants also need to forecast changing costs. The USDA Food Price Outlook predicts food-away-from-home prices will rise 3.6% in 2026, slightly faster than their 20-year historical average of 3.5%. A restaurant can meet its sales forecast and still miss its profit target if food or labor costs rise faster than expected.
Types of restaurant forecasting
The four main types of restaurant forecasting are sales and demand forecasting, inventory forecasting, labor forecasting, and cost and cash-flow forecasting. Each forecast answers a different question, but they work best when combined into one operating plan.
Forecast type | What it predicts | Decisions it supports |
Sales and demand | Revenue, guest counts, transactions, and item demand | Prep, service capacity, and financial planning |
Inventory | Ingredients and products required | Purchasing, order timing, and waste control |
Labor | Employees and hours required | Scheduling, overtime, and shift coverage |
Cost and cash flow | Food, payroll, and operating expenses | Pricing, budgets, and investments |
Sales and demand forecasting
Sales forecasting estimates how much revenue a restaurant will generate, while demand forecasting estimates the guest, transaction, or item volume behind that revenue.
Restaurants should separate sales by shift, location, revenue center, and ordering channel when possible. Dine-in, takeout, delivery, catering, food, and bar sales may follow different patterns even when total revenue remains stable.
Inventory forecasting
Inventory forecasting converts expected menu-item demand into ingredient and product requirements. Operators then adjust those requirements for current stock, recipe quantities, shelf life, vendor lead times, delivery schedules, and safety stock.
The financial opportunity is substantial. According to ReFED’s foodservice research, U.S. foodservice operations generated 12.5 million tons of surplus food in 2024. ReFED valued that surplus at $157 billion, equal to approximately 14% of foodservice sales.
Labor forecasting
Labor forecasting estimates how many employees and labor hours a restaurant needs to support expected demand. Forecasting by role and service period creates a more useful staffing plan than estimating one total number of hours for the day. One basic calculation is:
Forecasted labor hours = Forecasted sales ÷ Target sales per labor hour
If a restaurant forecasts $8,000 in sales and targets $80 in sales per labor hour, it would initially plan for 100 labor hours. Managers could then distribute those hours across kitchen, service, management, and support roles.
Cost and cash-flow forecasting
Cost forecasting predicts the food, payroll, occupancy, and operating expenses required to generate projected sales. Cash-flow forecasting estimates when money will enter and leave the business.
Together, these forecasts help restaurants anticipate vendor payments, payroll, rent, taxes, debt obligations, and other expenses. They also show whether forecasted sales are likely to produce the expected margin.
Restaurant Metrics Calculator
Use this free calculator to calculate the key restaurant metrics needed to understand the health and success of your business.
How to create an accurate restaurant forecast
An accurate restaurant forecast starts with reliable data, accounts for current conditions, and ends with a clear operating plan. Restaurants should then compare the forecast with actual results and use each variance to improve the next projection.
1. Gather connected restaurant data
Begin with the information most closely related to the outcome being forecast. Toast Reporting and Analytics gives operators access to historical sales, labor, product mix, and performance data across relevant periods. Known future business can make the forecast more precise:
Reservations: Toast Tables captures reservations and waitlist activity that can help operators anticipate dine-in traffic.
Catering and events: Toast Catering & Events records upcoming events and large orders that affect sales, prep, inventory, and labor.
Digital orders: Toast Online Ordering routes scheduled and digital orders into the restaurant’s workflow, adding another source of known demand.
Review the data for missing transactions, incorrect time-clock records, inconsistent menu items, and outdated inventory counts. Forecasting tools cannot fully compensate for inaccurate inputs.
2. Establish a historical baseline
Compare the upcoming period with days, shifts, or seasons that operated under similar conditions. Recent Friday dinners will generally provide a stronger baseline for another Friday dinner than an average that includes every day and service period.
Year-over-year comparisons can reveal seasonality, while recent week-over-week comparisons can capture newer changes in traffic or spending. Operators should identify closures, unusual promotions, extreme weather, and one-time events before calculating the baseline.
3. Adjust for current conditions
Historical performance is a starting point, not a complete forecast. Adjust the baseline for conditions that could make the upcoming period different, such as:
Committed demand: Reservations, catering orders, private events, and large parties provide concrete information about upcoming business.
Calendar effects: Holidays, school schedules, sporting events, concerts, and festivals can change traffic and purchasing patterns.
Operating conditions: Weather, construction, road closures, promotions, new prices, and changing hours can affect sales and demand.
Cost changes: New vendor prices, wage rates, overtime, and other expenses can change margins even if sales meet expectations.
Toast IQ can help operators analyze restaurant data and prepare for anticipated conditions, while managers contribute local knowledge that may not appear in historical reports. Be sure to document why each adjustment was made. That makes it easier to determine which assumptions improved the forecast and which should change next time.
4. Build an inventory, labor, and cost plan
Once the restaurant forecasts sales and demand, it can convert those projections into purchasing, production, staffing, and cash requirements.
Inventory and food costs
Translate expected item sales into ingredient requirements, then compare those quantities with current stock. Toast Inventory Management helps operators log stock, scan invoices, count inventory, and monitor inventory levels, providing a current starting point for purchasing and prep decisions.
xtraCHEF by Toast automates invoice processing and turns invoice data into food-cost insights. This helps restaurants incorporate current ingredient prices into purchasing and margin forecasts.
Scheduling and payroll
Turn projected sales or covers into staffing requirements by role and service period. Sling by Toast connects schedules with labor data, helping operators build schedules around expected demand and monitor weekly labor costs.
Toast Payroll & Team Management connects payroll workflows with restaurant operations and provides actual labor-cost data. Operators can therefore forecast payroll using wage and labor information rather than scheduled hours alone.
Cash requirements
Combine expected revenue with projected inventory purchases, payroll, occupancy costs, taxes, debt payments, and other expenses. This gives operators a clearer view of how much cash the restaurant may need and when major payments will come due.
5. Compare the forecast with actual results
After the forecast period, compare projected and actual sales, guest counts, average checks, item quantities, labor hours, food costs, stockouts, and waste. Use these two calculations to evaluate accuracy:
Forecast variance = Actual result − Forecasted result
Forecast error percentage = |Actual − Forecast| ÷ Actual × 100
Overforecasting and underforecasting should be tracked separately. Overforecasting can create excess food and labor costs, while underforecasting can lead to shortages, missed sales, and service problems.
Toast Now gives owners and managers mobile access to real-time sales and labor information. Comparing actual conditions with projections throughout the day helps managers adjust staffing, prep, inventory availability, and order flow before a small variance becomes a larger problem.
6. Use each variance to improve the next forecast
Sales results alone do not show whether a restaurant produced too much food. Operators should compare forecasted demand with actual production, sales, stockouts, spoilage, and waste.
A 2025 study published in Waste Management found that 45% to 73% of food waste at the examined hospitality and foodservice establishments was avoidable, with overproduction responsible for 20% to 92% of avoidable waste.
A data-driven intervention reduced food waste by 23% to 51% at most participating establishments and cut wasted-food cost per meal by as much as 39%. Restaurants can improve future forecasts by reviewing the cause of each variance:
Sales variance: Determine whether the difference came from guest traffic, average checks, service periods, or ordering channels.
Inventory variance: Review menu mix, portioning, spoilage, incorrect counts, and unexpected item demand.
Labor variance: Compare scheduled and actual hours, overtime, sales per labor hour, and staffing by role.
External variance: Document weather, events, closures, promotions, and other conditions that affected demand.
Forecasting should operate as a recurring cycle: Predict demand, create the operating plan, compare the forecast with results, identify the cause of each variance, and update the next forecast.
Build better restaurant forecasts with connected data
Restaurant forecasting is an ongoing process: establish a reliable baseline, account for current conditions, build an operating plan, compare projections with actual results, and use those insights to improve the next forecast.
Toast POS connects transaction data with tools for reporting, inventory, labor, payroll, and cost management. With more information in one connected system, operators can spend less time reconciling data and more time making informed decisions.
Restaurant Labor Cost Calculator
Unlock the power of data-driven labor management with our free Restaurant Labor Cost Calculator. Stop guessing and start optimizing your staffing decisions today.
FAQs
What is forecasting for restaurants?
Restaurant forecasting uses historical and current operational data to predict future sales, guest demand, inventory requirements, labor needs, and costs.
Why is forecasting important for restaurants?
Forecasting helps restaurants reduce food waste, prevent shortages, control labor costs, manage cash flow, and prepare for changes in guest demand.
What data is used in restaurant forecasting?
Restaurant forecasting uses data such as historical sales, guest counts, average checks, menu-item performance, inventory usage, labor hours, reservations, advance orders, costs, weather, and local events.
Do I need special software to forecast restaurant sales?
Restaurants can create basic sales forecasts manually, but connected forecasting and reporting tools make it easier to analyze data, identify patterns, and compare projections with actual results.
How often should a restaurant update its sales forecast?
Restaurants should review short-term sales forecasts daily and update them whenever reservations, weather, events, costs, or actual performance change significantly.
Restaurant Competitive Analysis Template
Use this free template to size up your competitors, analyze your market, and identify your restaurant’s strengths, all in one place.


บทความนี้มีประโยชน์สำหรับคุณหรือไม่
ข้อความปฏิเสธความรับผิดชอบ ข้อมูลนี้จัดทำขึ้นเพื่อวัตถุประสงค์ในการให้ข้อมูลทั่วไปเท่านั้น และการเผยแพร่ข้อมูลนี้ไม่ถือเป็นการรับรองใดๆ Toast ไม่รับประกันความถูกต้องหรือความสมบูรณ์ของข้อมูล ข้อความ กราฟิก ลิงก์ หรือรายการอื่นใดที่รวมอยู่ในเนื้อหานี้ Toast ไม่รับประกันว่าคุณจะได้รับผลลัพธ์ที่เฉพาะเจาะจงใดๆ หากคุณปฏิบัติตามคำแนะนำในเอกสารนี้ คุณอาจต้องปรึกษาผู้เชี่ยวชาญ เช่น ทนายความ นักบัญชี หรือที่ปรึกษาทางธุรกิจ เพื่อขอคำแนะนำที่เหมาะสมกับสถานการณ์ของคุณโดยเฉพาะ
 กำลังมาแรง



Subscribe to On the line
Sign up to get industry intel, advice, tools, and honest takes from real people tackling their restaurants' greatest challenges.
เมื่อส่งข้อมูล แสดงว่าคุณตกลงที่จะรับอีเมลการตลาดจาก Toast เราจะจัดการข้อมูลของคุณตาม คำชี้แจงความเป็นส่วนตัว ดูข้อมูลเพิ่มเติมสำหรับผู้อยู่อาศัยในรัฐแคลิฟอร์เนียได้ที่ คลิกที่นี่